



kotak Mahindra Bank Chart Analysis as on 30-Mar-2025.
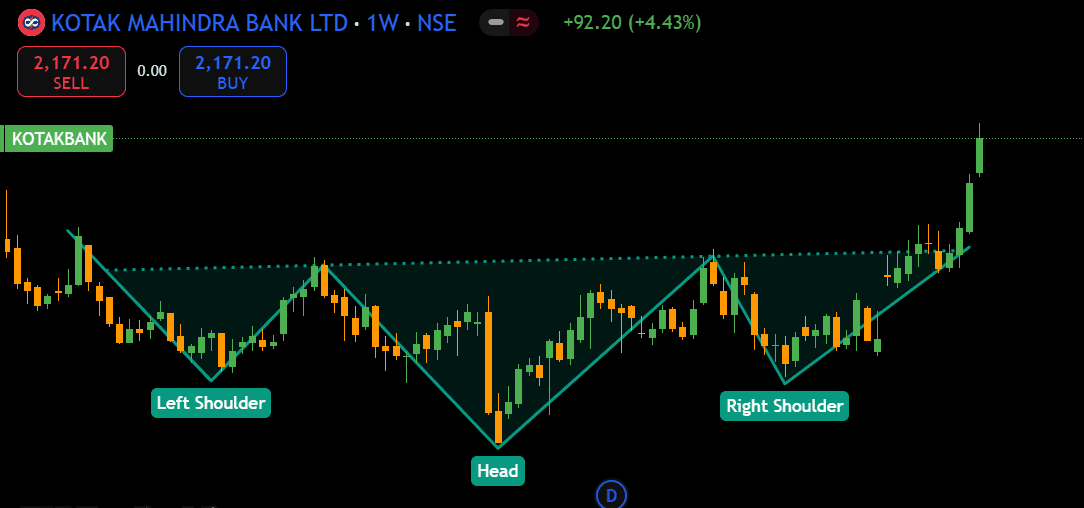
There was a inverted head and shoulder pattern clearly visible in Kotak Mahindra Bank on Weekly charts and the break out of the same took place this month around 1940 levels. It was among one of the top gainers of Nifty.
The break out of the pattern took place above 1940 levels and the target as per the head and shoulder pattern was the height of the head. That is the deference between the high of 1926.50 made on 26-Dec-23 and low of 1543.85 made on 29-Apr-2024.
Thus the difference is 1926.50 - 1543.85 = 382.65. So, the target of Kotak bank as per the inverted head and shoulder pattern is 1940 + 382.65 = 2322.65. Thus in the charts you can see that stock as already made an high of 2202.50.
Happy Learning and happy Trading.
KOTAKBANK
#WatchOutFor#EquityResearch#PsychologyofMoney#HiddenGems#TechnicalViews
114 likes