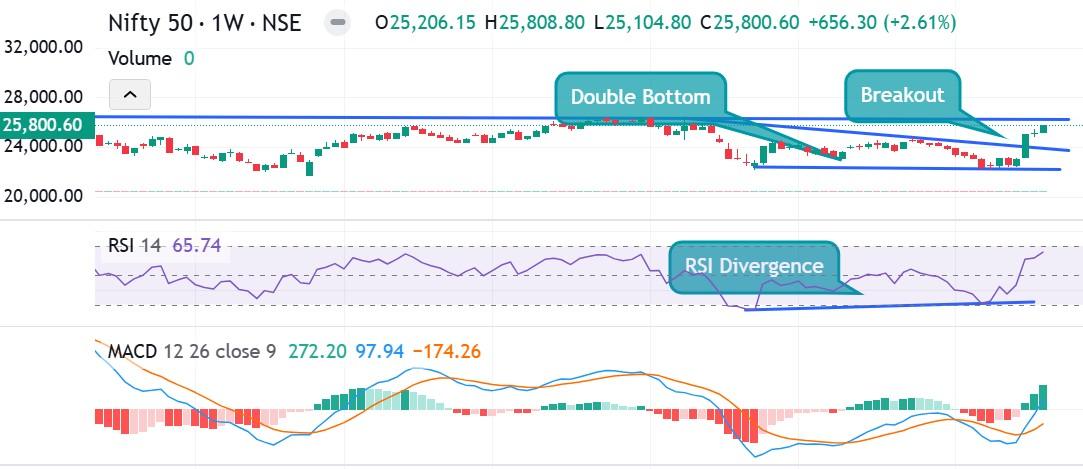
NIFTY Breakout on Weekly Charts and a follow up
For the week ending 20 November 2026, the Nifty 50 closed at 25,800.60, gaining 656.30 points (+2.61%) to register its fourth consecutive weekly advance and a nine-month closing high. On weekly charts we see a Trendline Breakout an entire candle body out and a follow up candle. Nifty is facing resistance around 26300 to 26400 Levels from september 2024 and has tested this levels multiple times. A breakout above this levels we may see Nifty making new lifetime highs and 22500 Levels would act as the immedeate support. We see a double bottom where in Nifty is making almost similar lows of 22,182.55 and 22179.90. We also see a bullish RSI divergence has emerged on the Weekly Chart while price printed a lower low or double bottom, the RSI formed a higher low, signaling fading selling pressure and a potential upward reversal. Weekly RSI 14 above 60 indicates a bullish trend and The MACD histogram above zero on the weekly chart is flashing green bars, signaling growing bullish momentum. Weekly Top Gainers : MAXHEALTH, APOLLOHOSP, EICHERMOT. MAXHEALTH