



NIFTY CHART ANALYSIS - POST MARKET COMMENTARY
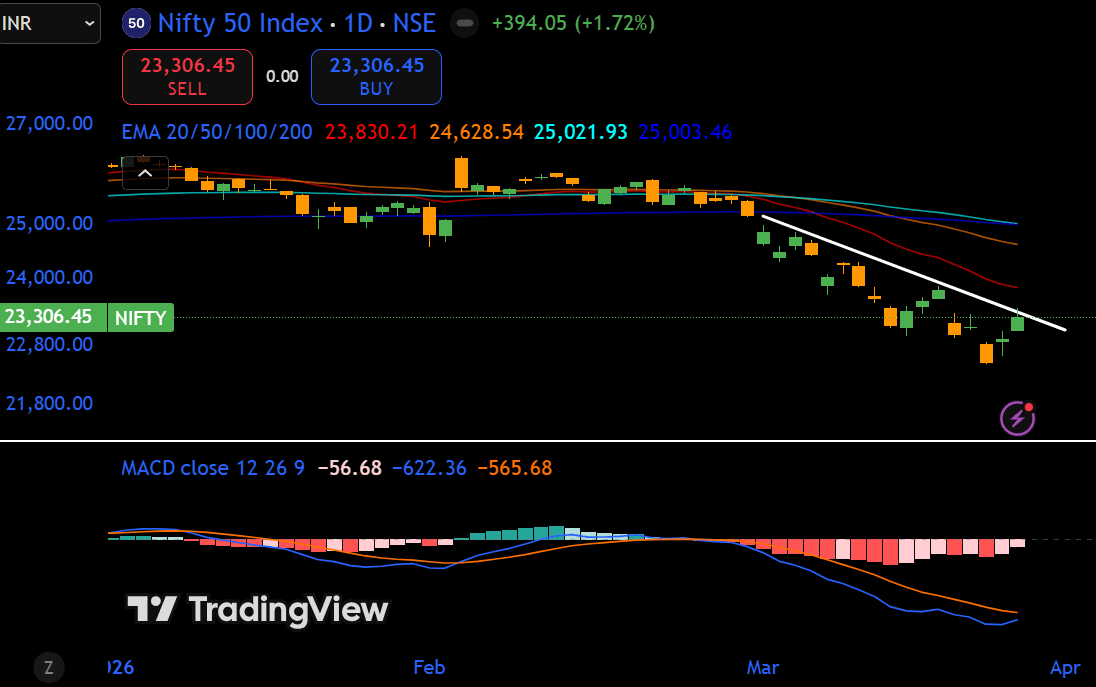
We have seen some upward movement in Nifty last couple of trading days. But, Nifty is still trading below all the short and long term EMA ( exponential moving average) of 20, 50,100, & 200 EMA.
MACD Histogram is still trading below zero and RSI is below 50 levels on Daily Charts. You can also see a trendline drawn which is acting as a resistance on Daily Chart.
We can expect a reversal only if Nifty breaks above the trendline and price sustains above it for couple of days with MACD Histogram moving above zero confirming the same and need to check RSI moving above 50 and sustains above it.
The over all trend of Nifty looks still bearish as per daily charts.
Top Gainers : SHRIRAMFIN TITAN GRASIM
Top Losers : TECHM POWERGRID TCS
#WatchOutFor#IndexStrategies#MacroViews#TechnicalViews#Post-ClosingCommentary
1,198 likes·74 comments