



Sensex Outlook on weekly charts as on 29-Mar-2025
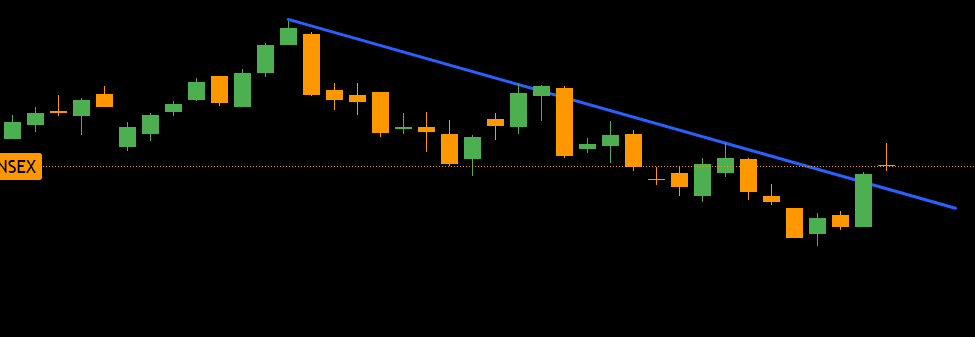
Sensex has given a break out above the trend line on weekly charts. But immediately after the break out we see a doji candle stick on weekly basis. The market opens at 77456.27 and closes around 77414.92. Sensex open and close ended in a small range for the week.
A doji candle stick is indicating indecision or a balance between buyers and sellers. Thus we need to have patience need to wait for the Sensex to confirm the new trend. See the details of the analysis in the chart.
Happy Learning, Happy Trading and have a wonderful weekend 😊
Top Gainers for the Month : KOTAKBANK ICICIBANK ULTRACEMCO
Top Losers for the Month : INDUSINDBK
#WatchOutFor#IndexStrategies#TechnicalViews#PsychologyofMoney#MacroViews
267 likes·44 comments