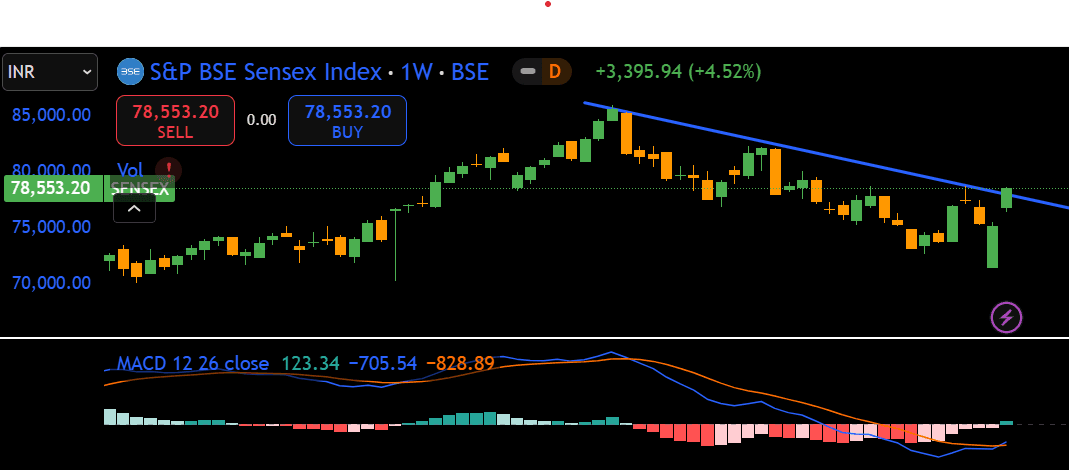
Sensex Weekly Chart Analysis.
Sensex as given a close above the trend line on weekly basis. Sensex has not broken and closed above the previous swing high of 78,741.69 on weekly basis.
Now, We need to wait and watch if Sensex sustains above the trend line. If Sensex Sustains above the trend line and if see the the entire candle body closing above the trend line this week. Then the next week if the price breaks above the highs of the candle outside trend line. we can think that the the downtrend is over.
On the weekly chart MACD has crossed above zero which indicates positive momentum in Sensex in the coming weeks.
Please see the chart in order to understand the Trend Line Break outs and Macd indicator.
Happy Learning and Happy Trading.
Top Gainers :