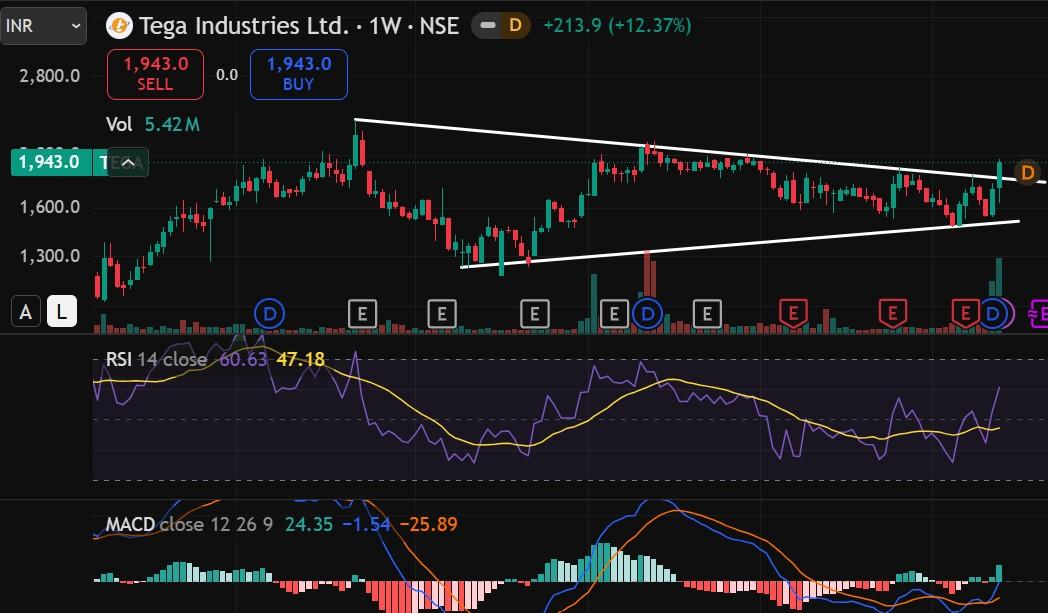
Tega Industries Breakout: Weekly Chart Technical Analysis
Tega Industries Ltd staged an explosive performance during the week ending September 18, 2026. Bouncing back sharply against a broadly pessimistic market environment, the stock capitalised on structural accumulation. A major part of this late-week momentum was fueled by an official corporate catalyst, as the company bagged a massive ₹126 crore engineering and supply order from Kalpataru Projects International.
Technically the stock is trading above all it's short, medium and long term Exponential Moving Averages.
On weekly charts the stock has given a break out above the trendline after a consolidation. The weekly RSI has experienced a sharp northward trajectory, ascending to 60.63. An RSI value crossing above the 60 mark confirms that the stock has officially exited its sluggish neutral zone and entered a high-velocity bullish momentum zone and the stock remains significantly below the traditional overbought boundary of 70. This implies that the stock possesses ample headroom to continue its upward extension before encountering exhaustion.
The Macd Histogram is expanding with vibrant green bars, demonstrating that buying velocity is accelerating hand-in-hand with expanding institutional participation.
The confluence of a high-volume structural breakout, a bullish Exponential Moving Average alignment, and strong confirmation from momentum oscillators we may see more upside in Tega Industries.