LAURUS LABS – Breakout Chart Pattern Discussion
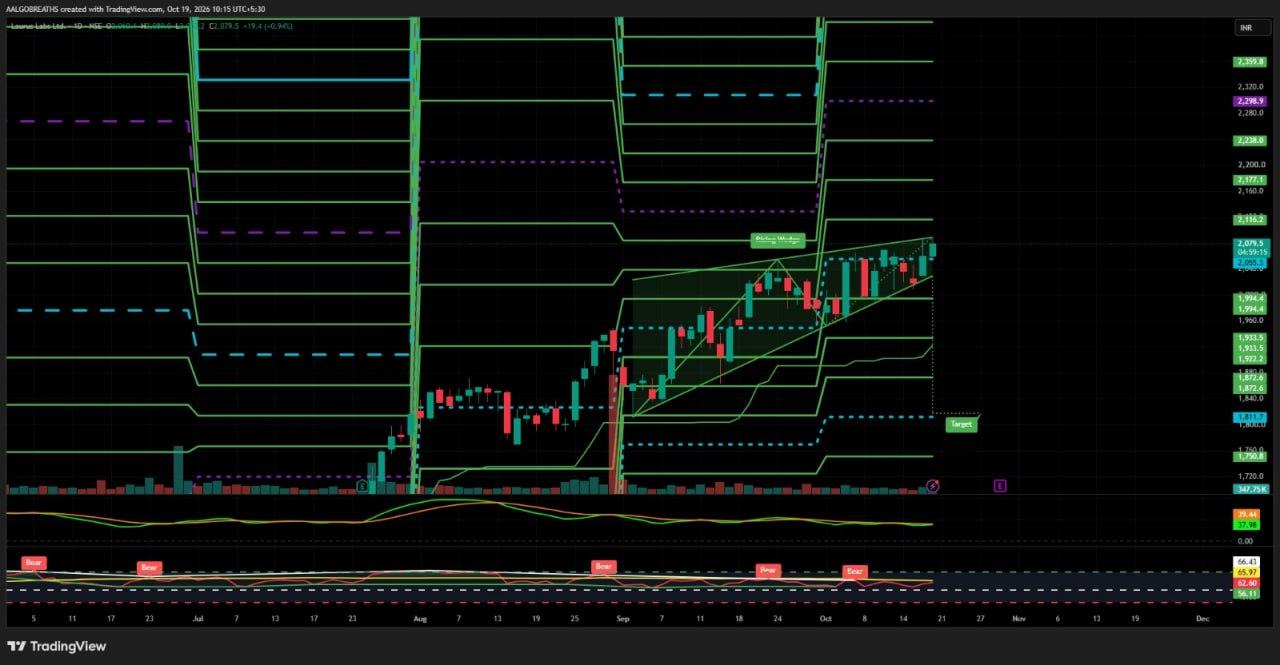
Laurus Labs Ltd. is trading near ₹2,079 and remains in an upward trend, with price action indicating continued buying interest. However, the stock appears to be approaching an important resistance zone, while a rising-wedge pattern warrants close monitoring. Although the prevailing trend remains positive, a decisive breakout with strong volume confirmation will be important to establish whether the bullish momentum can continue.
🔎 Technical View:
The immediate resistance zone lies between ₹2,079 and ₹2,116. A sustained move above this range could strengthen the bullish structure and potentially open the way for further upside. On the downside, the support levels at ₹1,994, ₹1,933 and ₹1,872 are important reference points for assessing the strength of the current trend. Since rising-wedge patterns can sometimes precede a correction, traders should monitor both breakout and breakdown signals carefully.
🔑 Key Technical Levels:
Current Reference Price: ₹2,079
Immediate Support: ₹1,994
Secondary Support: ₹1,933
Major Support: ₹1,872
Immediate Resistance: ₹2,079–₹2,116
Potential Upside Levels: ₹2,116, ₹2,177 and ₹2,238
📈 Potential Outlook:
If Laurus Labs sustains above ₹2,116 with strong buying volume, the stock may gain further momentum toward ₹2,177, followed by ₹2,238. However, failure to cross the resistance zone could result in consolidation or profit booking. A decisive breakdown below ₹1,994 may weaken the prevailing structure and increase the possibility of a decline toward ₹1,933 and ₹1,872.
⚠️ Risk Management: Avoid chasing sharp price movements. Monitor volume, candle formations and confirmation around key levels before evaluating any trading setup. The mentioned levels are technical reference points, not guaranteed targets.
For educational and informational purposes only. This report is not a buy or sell recommendation.
— AALGO BREATHS 📊
#FundamentalViews#TechnicalViews#WatchOutFor#StockInNews#EquityResearch

 Equity Research
 Fundamental Views
 Hidden Gems
 Index Strategies
 International Market
 IPO
 Macro Views
 Miscellaneous
 Personal Finance
 Post-Closing Commentary
 Pre-Opening Commentary
 Psychology of Money
 Sector Breakout
 Stock In News
 Technical Views
 Time To Exit
 Today's Trading Setup
 Trending Sectors
 US Market
 Watch Out For