29 mins ago · SEBI Registration INH000019886
SEBI Registration INH000019886 · 29 mins ago
Oberoi Realty Ltd. – Technical Analysis Discussion
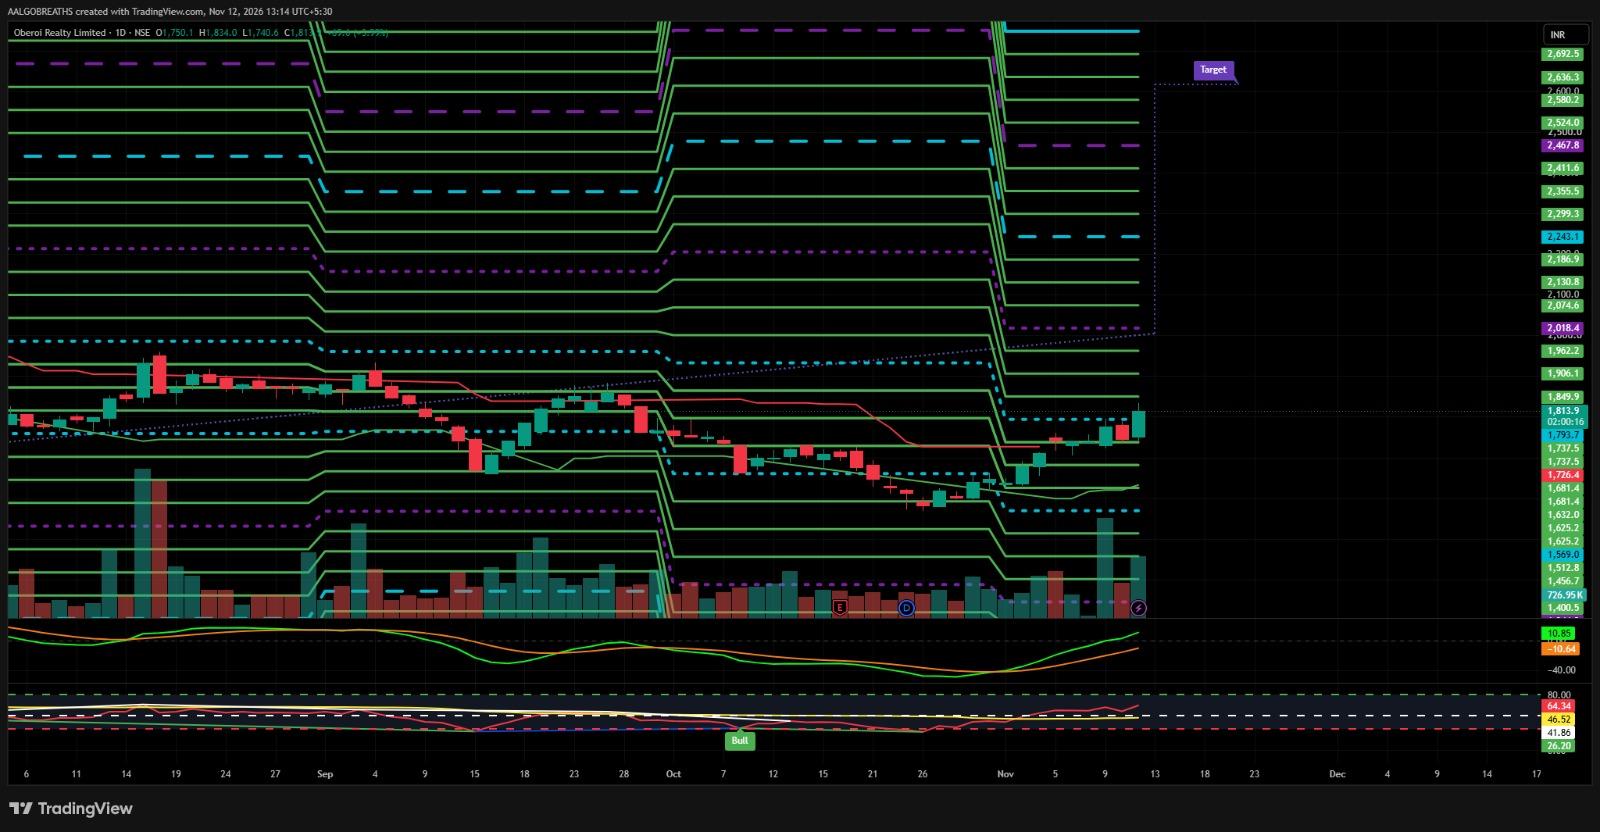
OBEROIRLTY Oberoi Realty Ltd. is showing signs of a bullish recovery on the daily chart after bouncing back from its recent support zone near ₹1,650–₹1,680. The stock is currently trading around ₹1,813, supported by improving price action, rising buying interest and positive volume activity. The recent upward movement indicates a potential improvement in its short-term trend. The immediate support zone is placed around ₹1,793–₹1,737, followed by ₹1,681. On the upside, immediate resistance is observed near ₹1,850–₹1,906. A sustained breakout above ₹1,906 could open the possibility of further upside towards ₹1,962 and ₹2,018. The next important resistance levels are placed around ₹2,074 and ₹2,130. Momentum indicators are showing positive signs, with MACD indicating improving bullish momentum. RSI around 64 suggests strengthening buying pressure without an immediate extreme overbought signal. Recent volume expansion also supports the ongoing recovery. Overall Technical Outlook: The short-term technical outlook is gradually turning positive, supported by improving momentum and a recovery in price structure. Sustaining above ₹1,793 will be important to maintain the bullish bias. A decisive breakout above ₹1,906, supported by volume, may strengthen the possibility of further upside. Traders should monitor key support and resistance levels and maintain disciplined risk management.