


26th Sep 2025 · SEBI Registration INA100014055
SEBI Registration INA100014055 · 26th Sep 2025
MFSL Technical Analysis .....
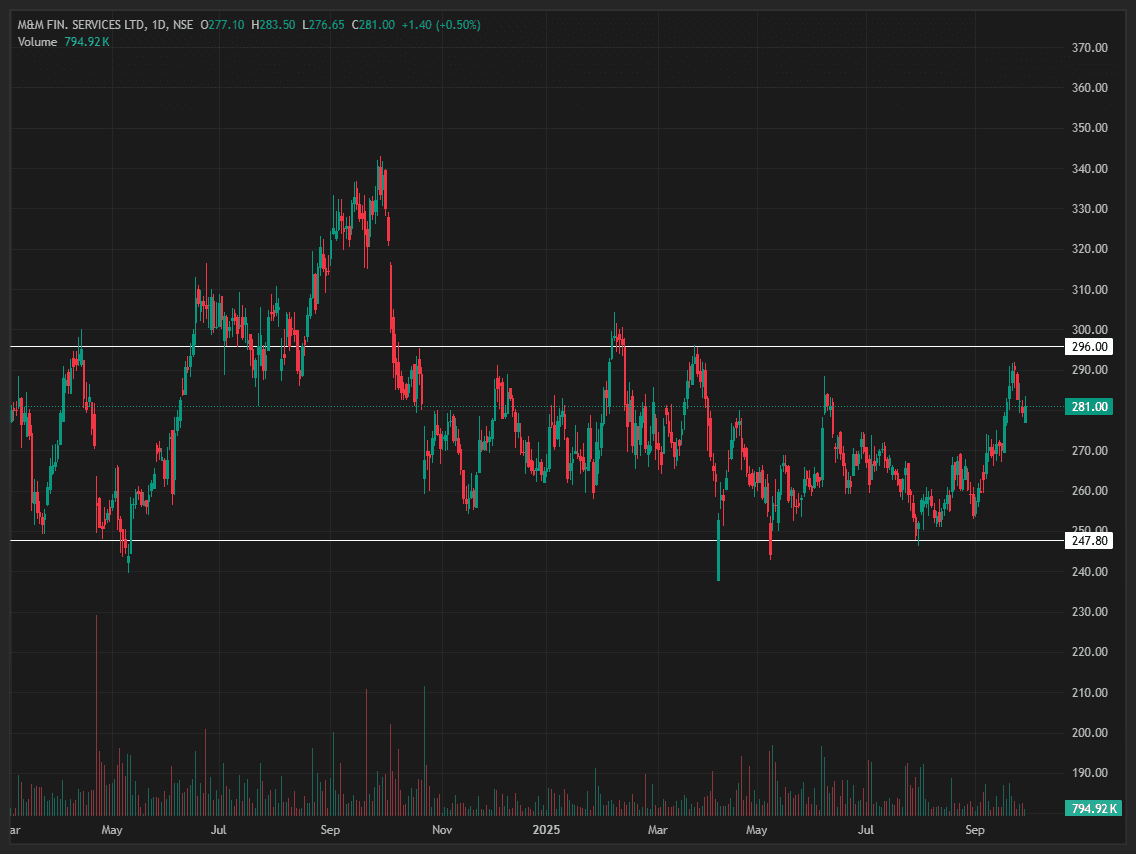
The chart for MFSL shows the stock trading in a well-defined horizontal range between resistance at ₹296 and support at ₹247.80, with the current price at ₹281.20 near the middle of this channel; sustained movement above ₹296 would suggest a breakout, while continued range-bound action can be expected unless either the upper or lower boundaries are breached.
#TechnicalViews
982 likes·65 comments