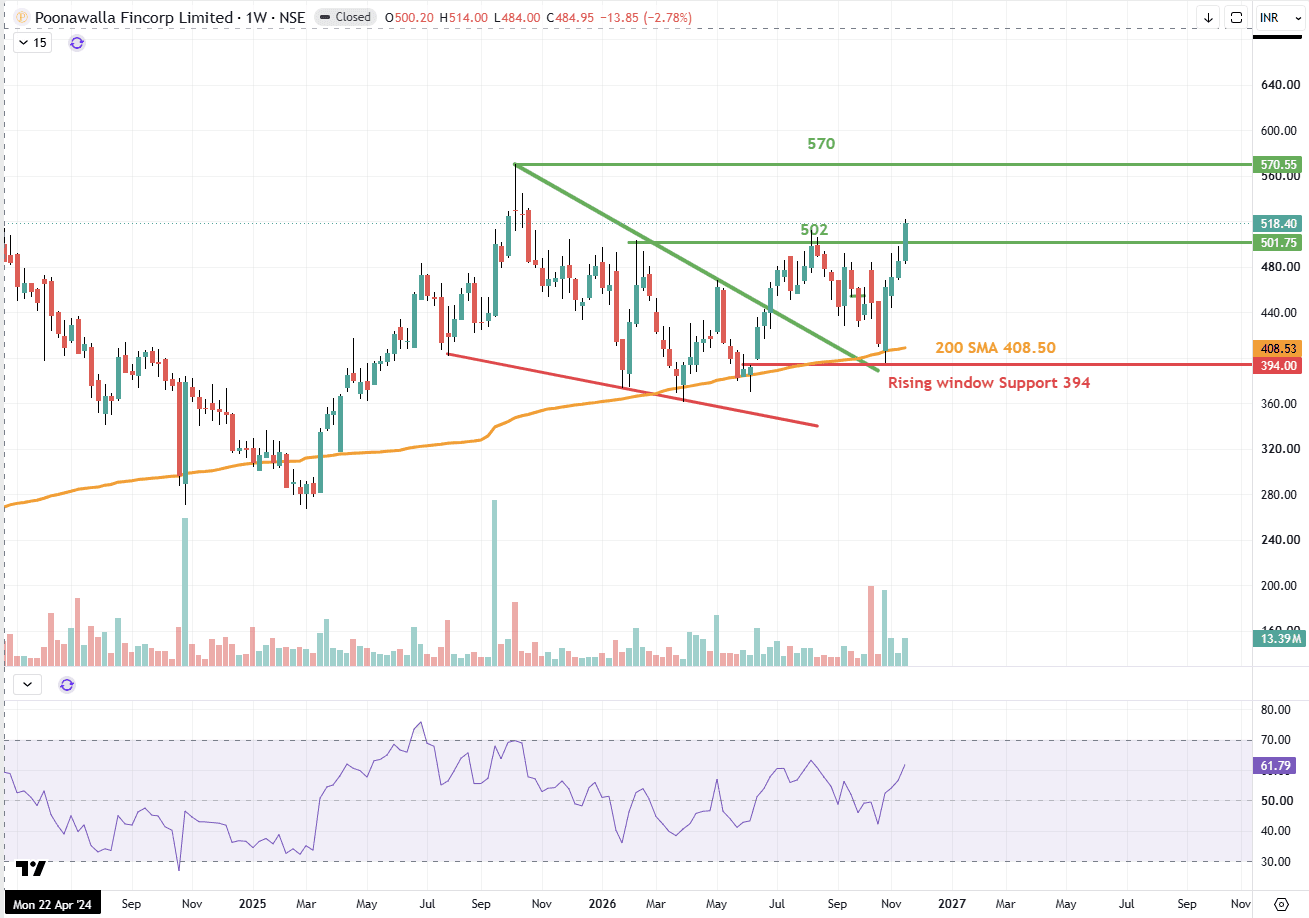
Breakout, Throwback, Demand: Poonawala Fincorp
The POONAWALLA weekly chart is a useful example of how a breakout and a throwback work together. The stock first broke above a falling trendline that had capped it since the October 2025 high. After the breakout, it did not run straight up. It drifted back towards the same area, where the broken trendline, the 200-week moving average and an earlier rising-window gap all sat close together. This return move is called a throwback. Support zones that overlap attract buyers, and here it showed up as a sharp bounce with a visible volume spike, which is the demand the textbook describes. The stock then rallied and has now moved above the earlier resistance near 502, with RSI improving and no longer weak. The lesson is that a throwback is a test of the breakout. When it holds on rising volume, it shows buyers defending the level. If price had closed back below the support zone, the breakout would have been in question. This post is an educational illustration of the concept and is not a view on the stock. A throwback tests a breakout; when price returns to the broken level and buyers defend it on rising volume, it confirms the breakout, but a close back below weakens it. Disclaimer: This is for educational purposes only and is not investment advice. Please consult your financial advisor before making any investment decisions. SEBI Registered Research Analyst — INH000025212.