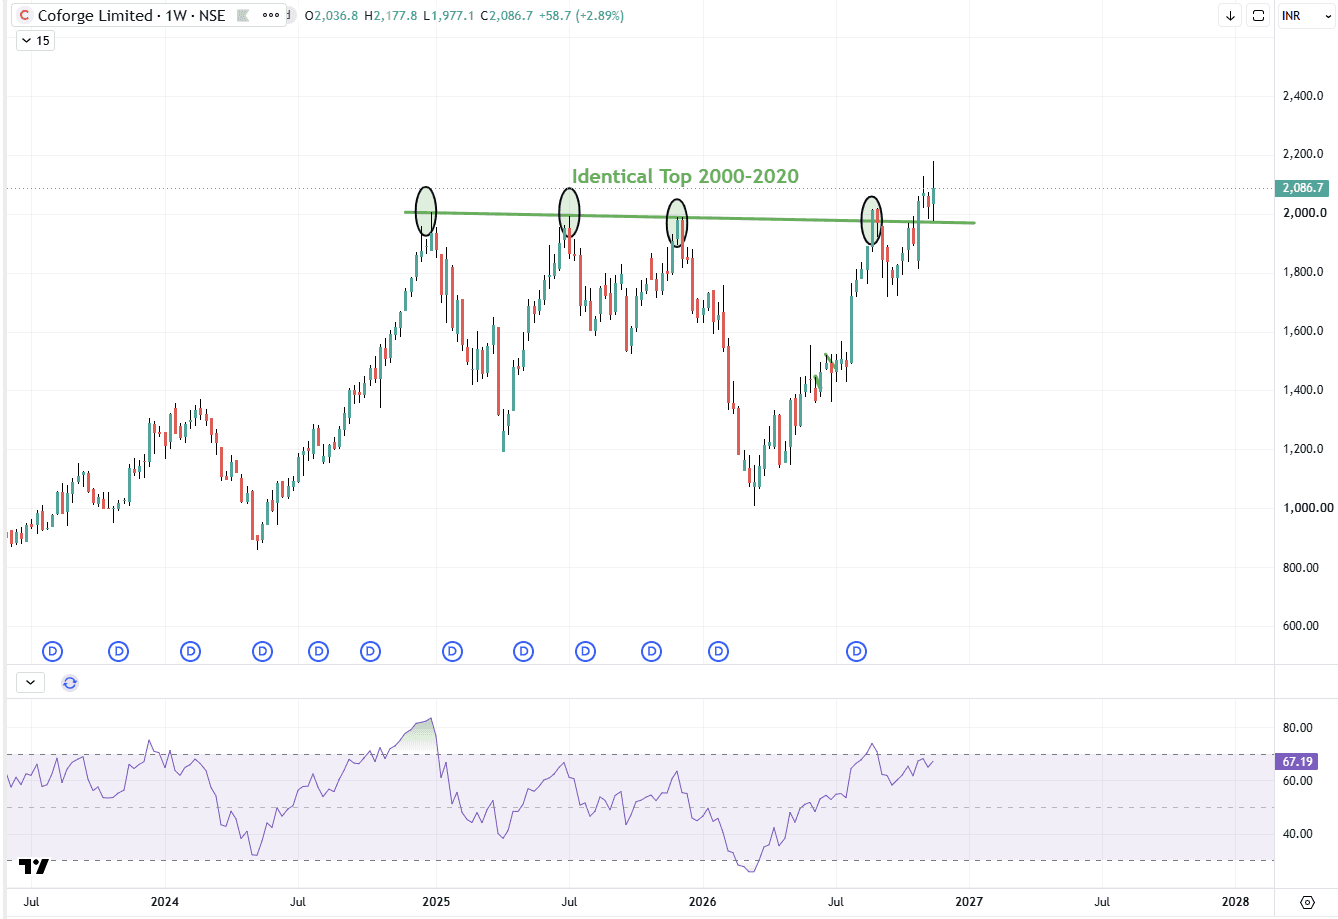
Coforge Clears Identical Top Zone of 2,000-2,020
COFORGE has moved above a resistance zone on the weekly chart that had capped it repeatedly. The 2,000-2,020 area formed identical tops several times from late 2024 through 2025 and into 2026, each time followed by a pullback. Equal highs like these show sellers defending the same level, so a decisive move above them matters. The stock closed the week at 2,086.7, up 2.89%, with a weekly high of 2,177.8. This week’s low near 1,977 came back to the old resistance zone and held, which is a classic retest of a broken level. RSI at about 67 shows strong momentum without being extreme. The 2,000-2,020 zone is now the first level to watch on the downside, and a weekly close back below it would weaken the breakout. After a break of a multi-year resistance, how the stock behaves above the zone, ideally with healthy volume, is worth observing. Repeated tops at the same level show strong resistance; a weekly close above it, followed by a successful retest, shows that the old resistance may now act as support. Disclaimer: This is for educational purposes only and is not investment advice. Please consult your financial advisor before making any investment decisions. SEBI Registered Research Analyst — INH000025212.