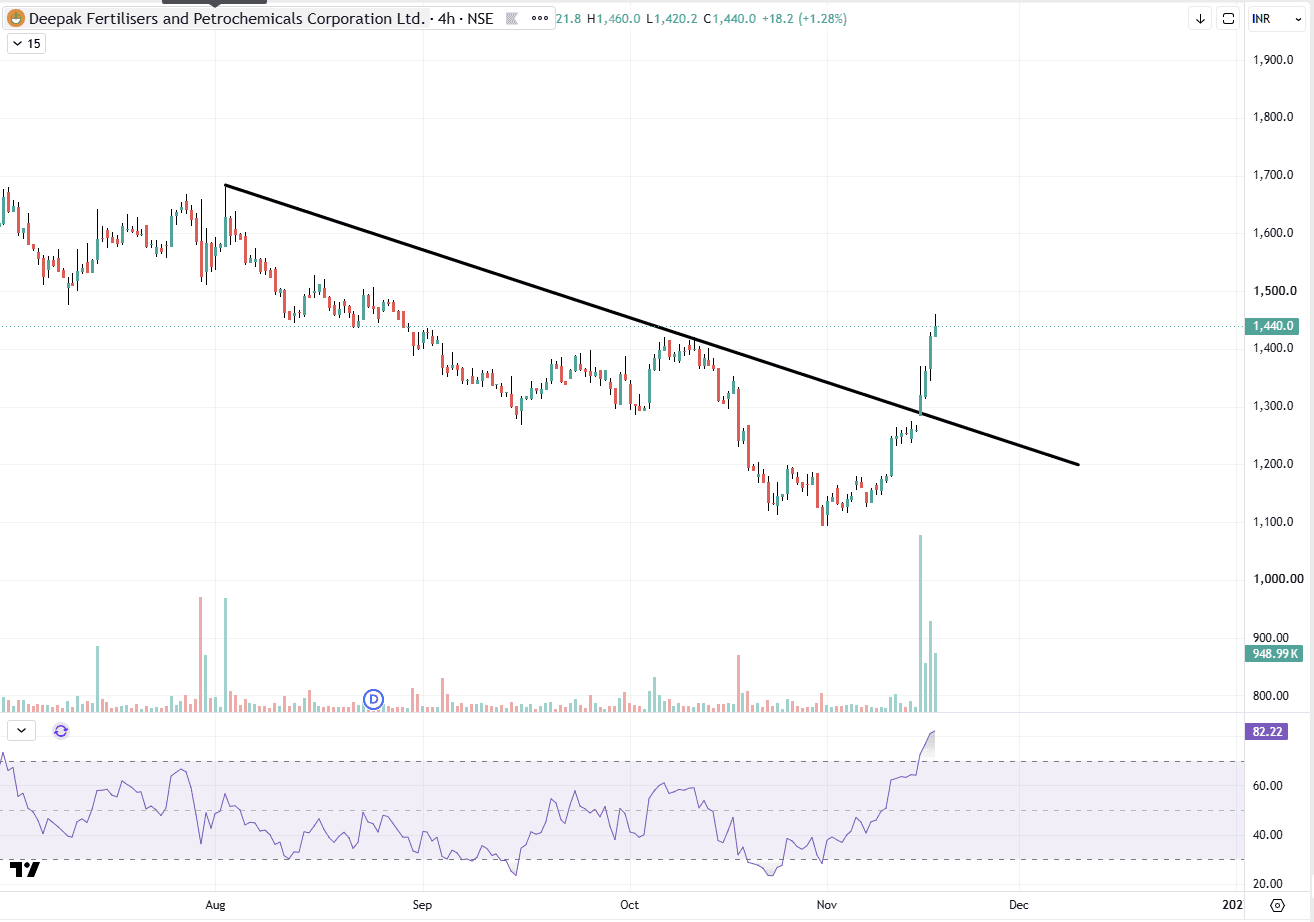
Deepak Fertilizers Breaks Falling Trendline
DEEPAKFERT has moved above the falling trendline that capped the stock from the August high, on the 4-hour chart. The stock is trading near 1,440, about 30% above the recent low near 1,100. The breakout area near 1,290-1,300 is now the first support to watch, as a broken trendline often turns into support. The move came with a visible surge in volume, which adds weight to the breakout. The stock has also gone past the October swing high near 1,420. RSI at about 82 is firmly overbought, which shows strong momentum but also a stretched move, so a pause, retest or consolidation would not be unusual. On the upside, the 1,520 area and the August high near 1,680 are the next references on the chart. Whether the stock holds above the trendline zone, with volumes staying healthy, is worth observing in the coming sessions. A close back below the trendline would weaken the setup. A trendline breakout with a volume surge shows strong participation; overbought RSI is a reminder that retests and consolidation are common after a sharp move. Disclaimer: This is for educational purposes only and is not investment advice. Please consult your financial advisor before making any investment decisions. SEBI Registered Research Analyst — INH000025212.