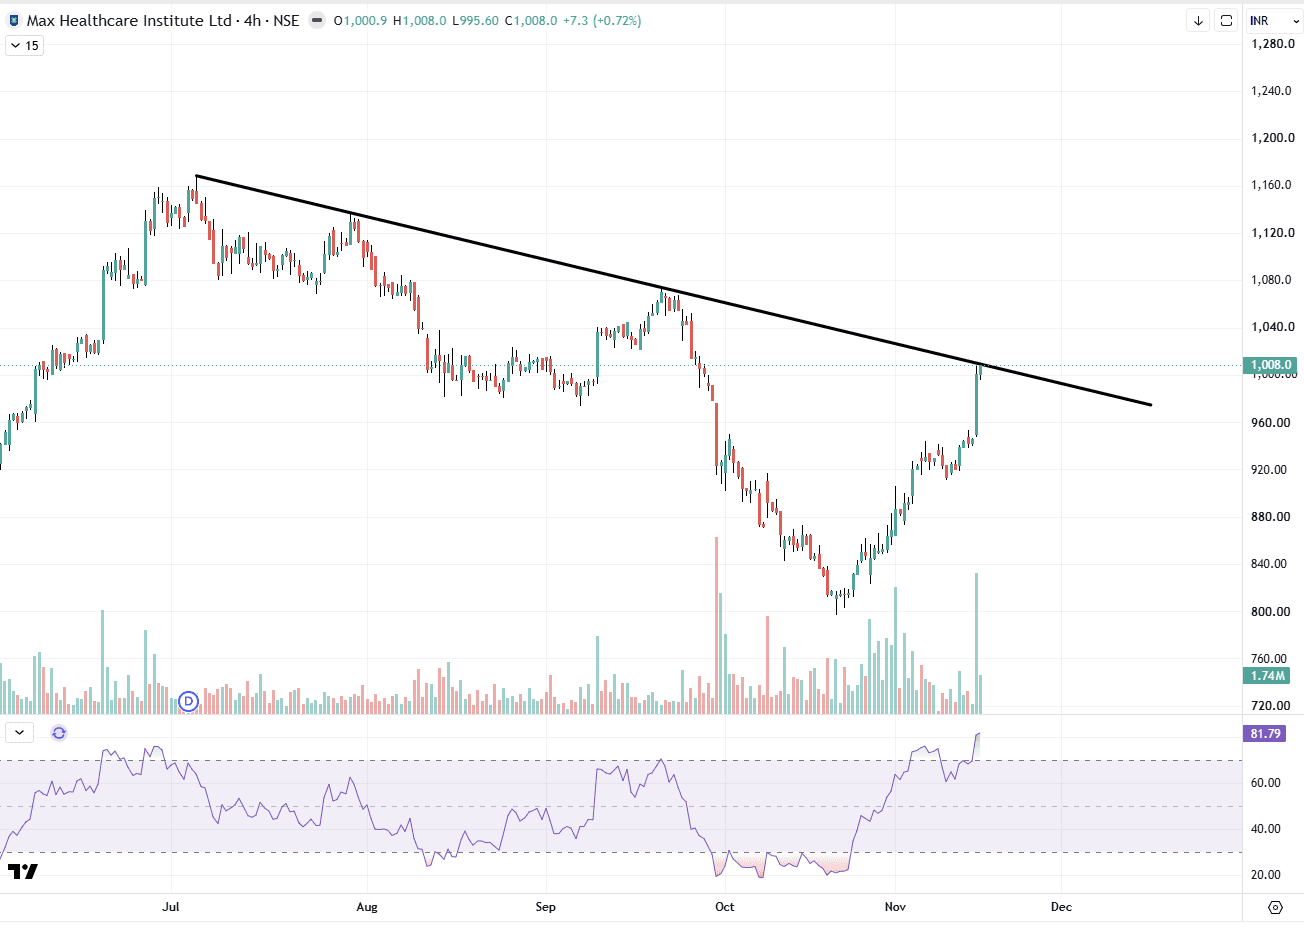
Max Healthcare Tests Falling Trendline Resistance
MAXHEALTH has staged a sharp recovery on the 4-hour chart, rising about 25% from the October low near 800 to around 1,008. The stock is now at the falling trendline drawn from the July high, which has capped every rally since then. The latest advance came with a visible volume surge, which adds weight to the move, but price is only testing the trendline and a breakout is not yet confirmed. RSI at about 82 is firmly overbought, which shows strong momentum but also a stretched move, so a pause or pullback near resistance would not be unusual. If the trendline is cleared and sustained, the September swing high near 1,075 and the July area above 1,130 are the next references on the chart. If the stock is rejected here, the 940 to 960 zone, where the last up-leg began, is the area to watch on the downside. Whether price sustains above the trendline, ideally with volume support, is worth observing in the coming sessions. A rally into a falling trendline needs a confirmed breakout; overbought RSI at resistance is a reminder that pauses are common. Disclaimer: This is for educational purposes only and is not investment advice. Please consult your financial advisor before making any investment decisions. SEBI Registered Research Analyst — INH000025212.