Chennai Petroleum: Alternate AB=CD Completion Meets Reversal
CHENNPETRO
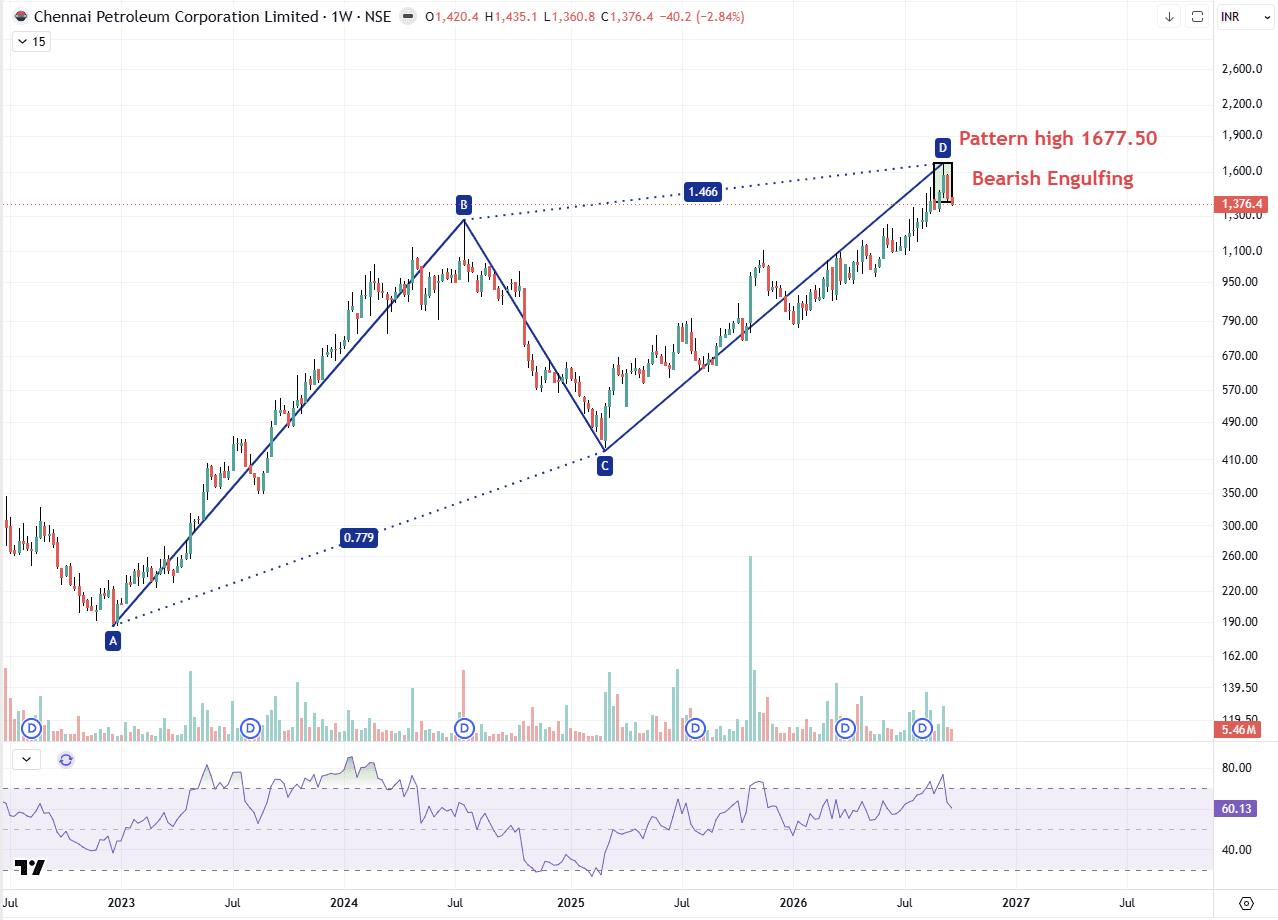
has completed an alternate AB=CD harmonic pattern on the weekly chart, with the D-leg extension reaching the 1.27 projection near the pattern high of 1,677.50. Right at this completion zone, price has printed a confirmed Bearish Engulfing candle, with the stock closing the week down 2.84% at 1,376.40 after touching a high of 1,435.10.
This combination — a harmonic pattern reaching its projected completion zone alongside a bearish reversal candle — is a classic technical setup where the two signals reinforce each other, raising the odds of at least a corrective pullback from current levels. RSI at 60.13 remains in bullish territory, though it will be worth watching for any rollover from here given the reversal candle at pattern highs.
Resistance: 1,677.50 (pattern high/PRZ), then 1,435.10 (recent swing high).
Support: 1,249 then 1,110 (prior breakout zone).
Whether this resolves into a broader correction or the pattern fails and price pushes past the Bearish Engulfing high is something that needs to be watched over the coming sessions rather than assumed either way.
When a harmonic pattern completes at the same zone as a reversal candle, the two signals reinforcing each other is often worth extra attention, but confirmation still matters.
Disclaimer:This is for educational purposes only and is not investment advice. Please consult your financial advisor before making any investment decisions. SEBI Registered Research Analyst — INH000025212.