‹ All Posts
ArthavrkshRA

9 hours ago · SEBI Registration INH000025212

JTL Industries: Goldman Buying vs the Chart

Fundamental pointers (Source: Money control, bulk deal data): On October 7, Goldman Sachs Investments Mauritius I bought 19.71 lakh shares of
JTLIND
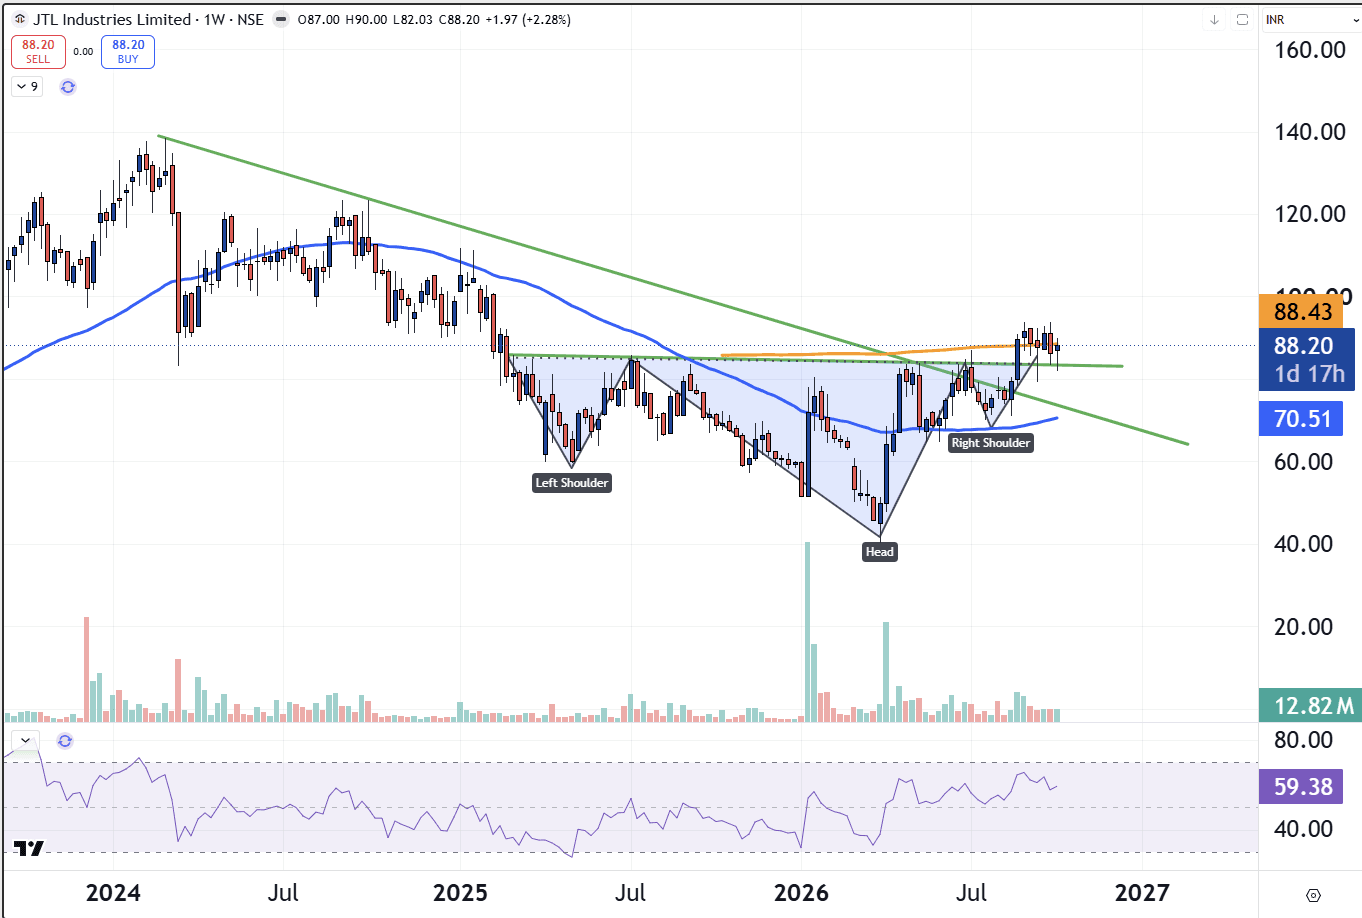
, about 0.5% of paid-up equity, at 82.03 per share for roughly Rs 16.16 crore. The stock rallied 4.34% to end at 88.20 on high volumes. A bulk deal shows a transaction, not the buyer's intent, and a 0.5% stake is a modest one. Technical pointers (weekly chart): The stock has formed an inverse Head & Shoulders, with a left shoulder near 58, a head near 42 and a right shoulder near 68-70. The neckline is near 85-86. Price is above the falling trendline from the 2024 highs, near the 200 SMA at 88.43, and RSI at 59.38 is above the midline. Chart check: The 82.03 buy price matches the weekly low, just under the neckline, so the buying coincided with the neckline retest zone. That alignment is constructive. Confirmation is still pending, though, as price sits right under the 200 SMA and volume since the neckline break has been moderate. Resistance: 88.43, then about 93 and 100. Support: 85-86, then 82 and 70. A weekly close above 93 would add confirmation, while a close back below 85 would weaken the setup. When institutional flows and chart levels line up, the setup gains context. A bulk deal is still only one data point, and price follow-through gives the confirmation. Disclaimer: This is for educational purposes only and is not investment advice. Please consult your financial advisor before making any investment decisions. SEBI Registered Research Analyst — INH000025212.

#EquityResearch#WatchOutFor#FundamentalViews#TechnicalViews#HiddenGems
07102026 JTL Industries.png
144 likes·48 comments