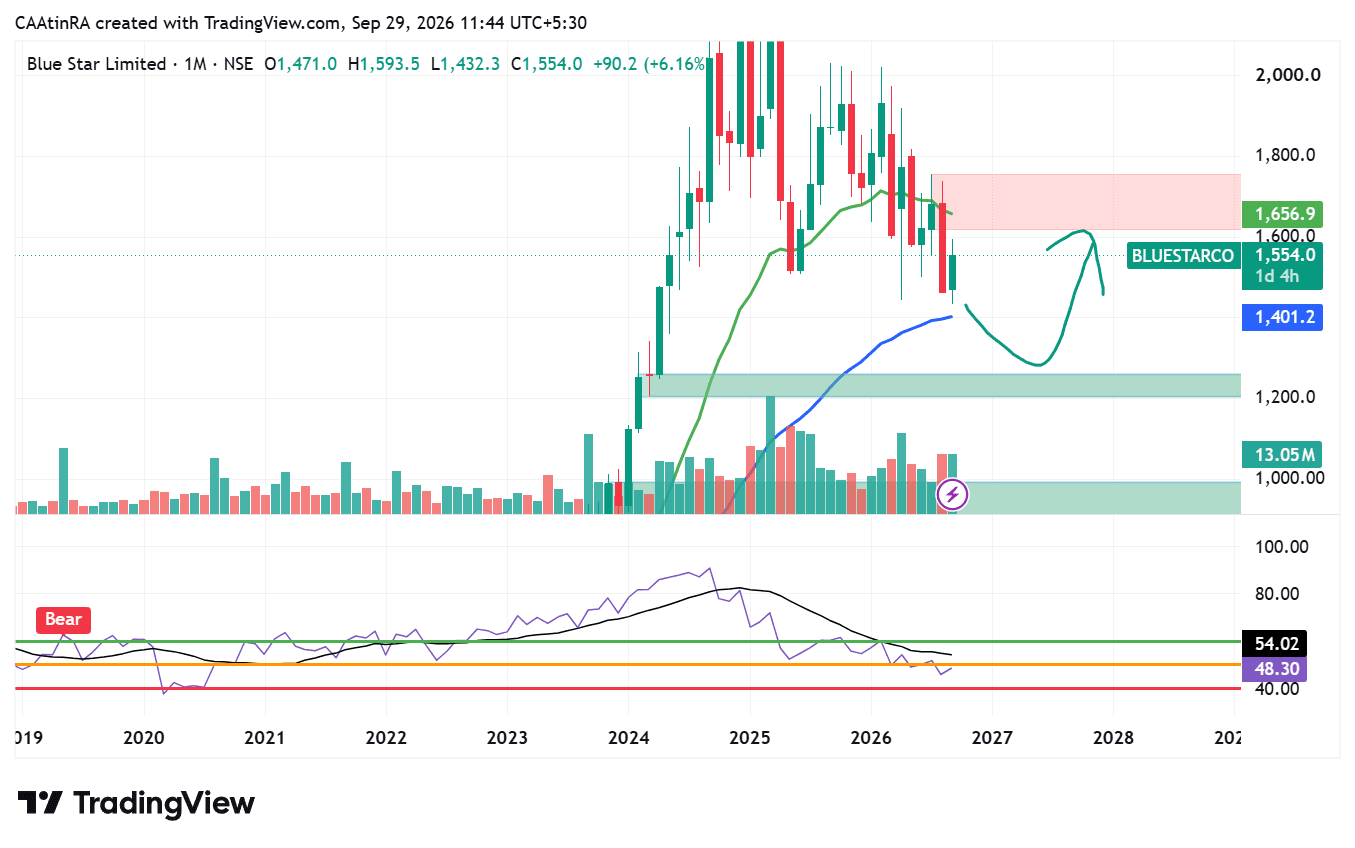
bluestar wait for the retracement to invest further
Reference price: ₹1,575 (28 September 2026 closing)
52-week range: ₹1,432–₹2,033
Market cap: ~₹32,289 crore
P/E: ~61x
ROE: ~17.2% | ROCE: ~21.2%
1. Price Action & Technical Structure
Blue Star has seen a meaningful correction from its 52-week high of around ₹2,033. The recent price action, however, shows some recovery from the ₹1,430–₹1,450 zone.
Recent sessions have been volatile:
15 Sep: Close ₹1,486.80
17 Sep: ₹1,540.60
19/21 Sep zone: around ₹1,560–₹1,565
25 Sep: ₹1,570
28 Sep: ₹1,575
This indicates that ₹1,500–₹1,520 is an important near-term demand/support zone, while ₹1,570–₹1,600 is an important supply area.
A technical-data source had earlier placed the immediate resistance zone around ₹1,574 and supports around ₹1,511 and ₹1,497.
2. Important Technical Levels
Immediate resistance: ₹1,590–₹1,600
Next resistance: ₹1,650–₹1,680
Major resistance: ₹1,700–₹1,720
Immediate support: ₹1,540–₹1,520
Major support: ₹1,500–₹1,480
Strong support: ₹1,430–₹1,450
From a chart-reading perspective, a sustained move above ₹1,600 with strong volume would improve the short-term structure, whereas failure around ₹1,600 followed by a break below ₹1,500 could again bring selling pressure.
3. Fundamental Picture
Blue Star remains a major player in India's air-conditioning and commercial refrigeration industry. Its FY26 revenue from operations was ₹12,401.99 crore, up 3.6%, while operating profit increased 6.2% to ₹930.41 crore. The company ended FY26 with a record carried-forward order book of ₹6,923 crore.
The order book is an important positive factor because it provides revenue visibility across the company's project businesses.
However, the latest Q1 FY27 numbers require some caution.
Revenue increased 13.3% YoY to ₹3,377.92 crore, but consolidated PAT declined 15.2% to ₹102.51 crore. EBITDA/operating margin also declined to approximately 5.2% from 6.7% in the year-ago quarter.
#WatchOutFor#EquityResearch#HiddenGems#TechnicalViews#FundamentalViews