



16th Oct · SEBI-Registered Analyst
Currency Grow (CA & SEBI Reg IA Omkar Bhutada) · 16th Oct
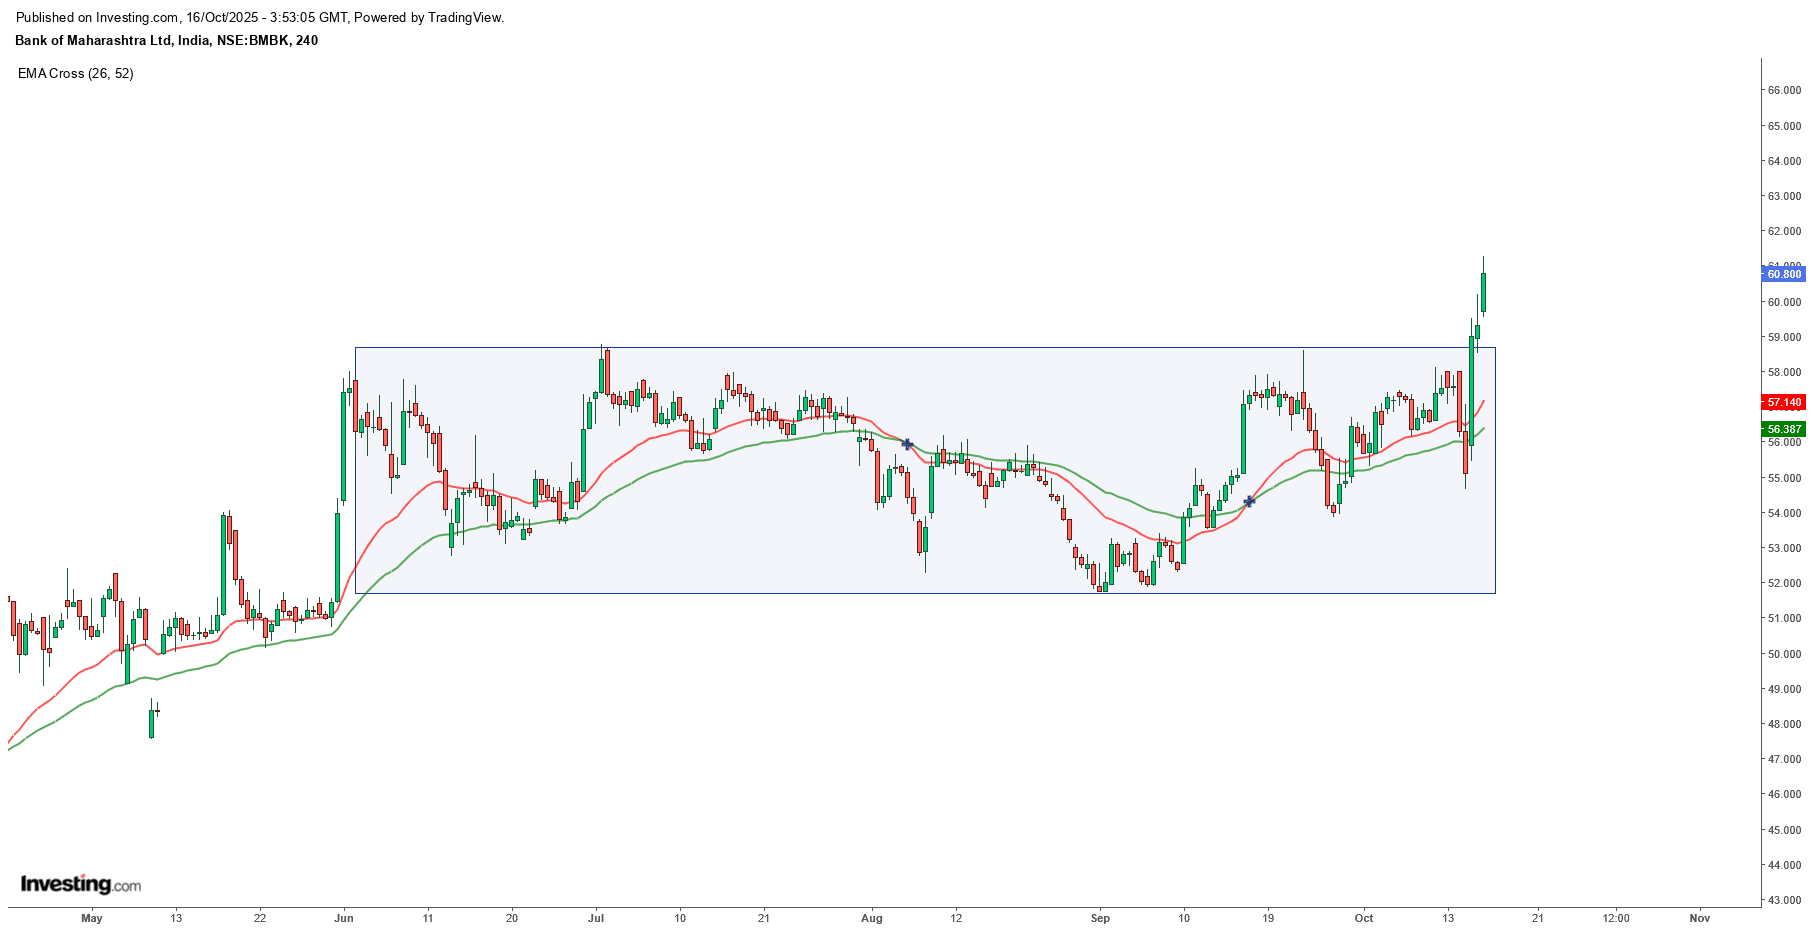
🏦 Bank of Maharashtra – Range Breakout on 4H Chart
MAHABANK
🧭 Technical Structure
Pattern: The stock has broken out of a 4-month horizontal range between ₹51 and ₹59 on strong momentum.
EMA Confirmation: The 26 EMA (red) has crossed above the 52 EMA (green), confirming a bullish crossover right at the breakout point.
Volume & Candle Strength: Sharp bullish candles post-breakout indicate institutional buying or accumulation.
Retest Possibility: A mild pullback toward ₹59–₹60 could act as a retest entry zone before the next leg up.
#WatchOutFor#Today’sTradingSetup#StockInNews#FundamentalViews#TechnicalViews
740 likes·45 comments