20th Jul · SEBI-Registered Analyst
Currency Grow (CA & SEBI Reg IA Omkar Bhutada) · 20th Jul
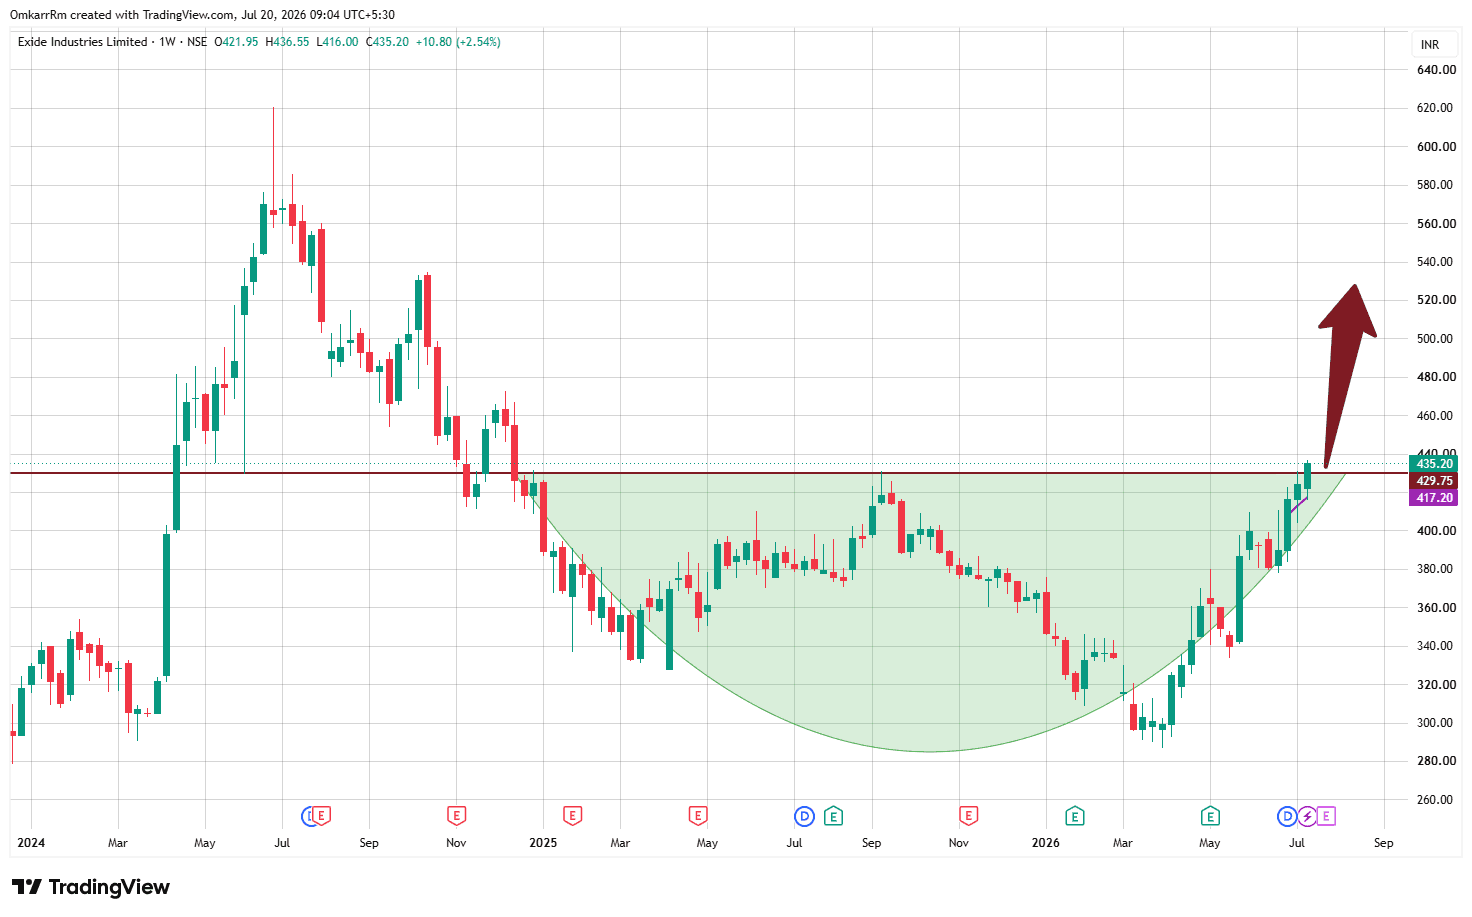
Exide Industries (Weekly Chart)
$EXIDEIND Technical Structure ✅ 1. 18-Month Base Formation The stock has spent nearly 1.5 years consolidating between: Support: ₹300–320 Resistance: ₹430 Long consolidations usually precede powerful trends because weak holders exit and institutions accumulate. ✅ 2. Resistance Has Been Tested Multiple Times The ₹430 level has acted as resistance on several occasions. Repeated tests generally weaken resistance. The current rally is the strongest attempt so far, which increases the probability of a successful breakout. ✅ 3. Rounded Bottom (Cup Formation) The green arc you've drawn highlights a well-formed rounded base: Smooth decline Extended accumulation Gradual recovery Return to resistance This is characteristic of institutional accumulation rather than speculative spikes. ✅ 4. Strong Momentum Into Resistance The recent advance has been: Consistent higher highs Higher lows Mostly bullish weekly candles Very little profit booking That's exactly the type of price action you'd like to see before a breakout. The Key Level Current price: ₹435 Major resistance: ₹430–435 This is the most important level on the chart. A weekly close above ₹435–440 would confirm the breakout.