20th Jul · SEBI-Registered Analyst
Currency Grow (CA & SEBI Reg IA Omkar Bhutada) · 20th Jul
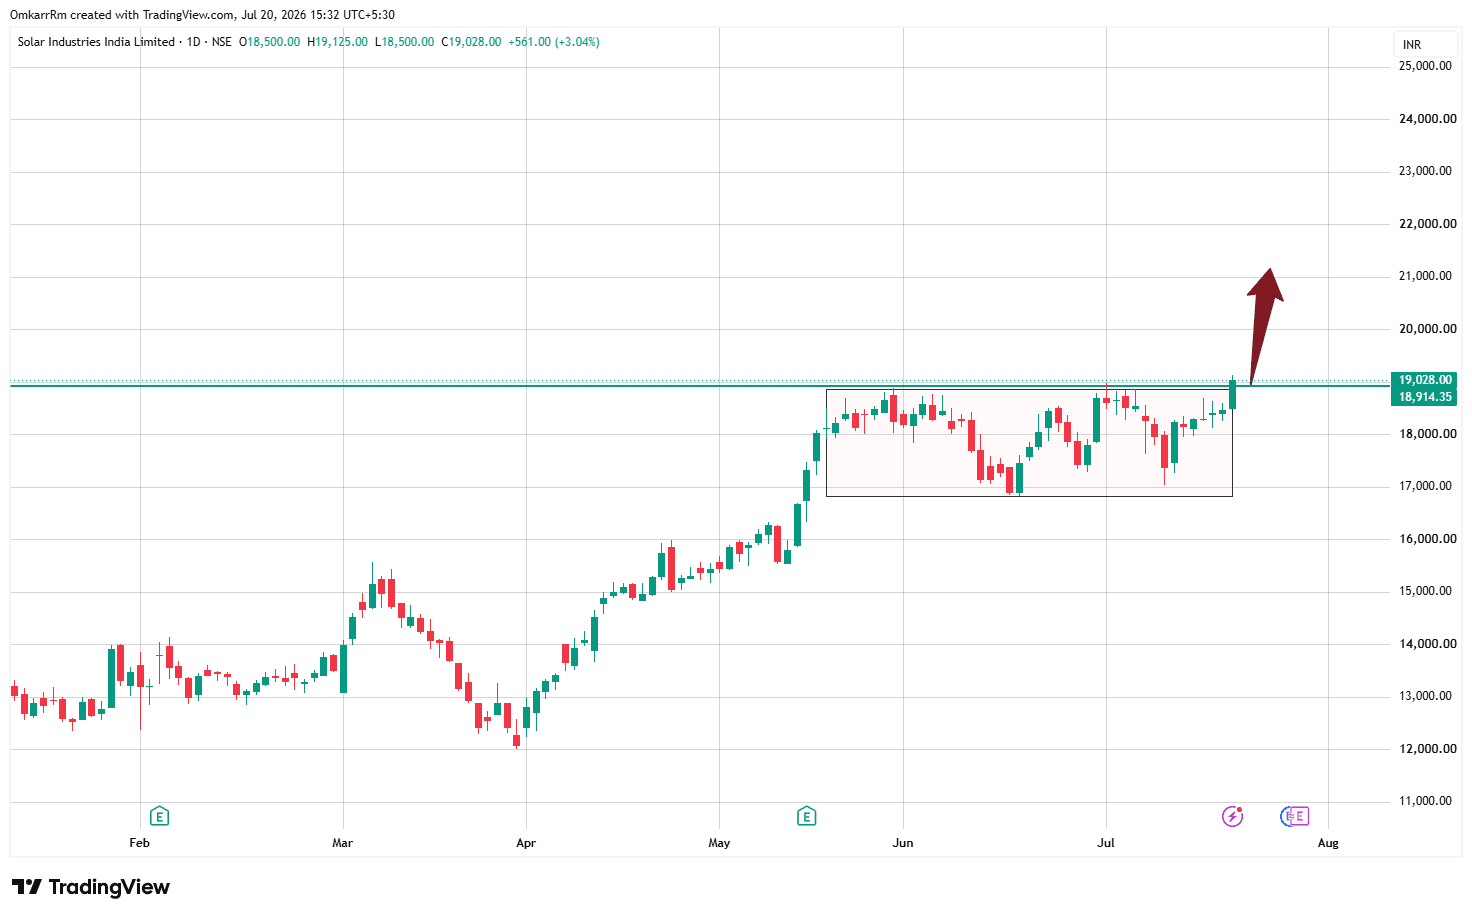
Solar Industries (Daily Chart)
$SOLARINDS Technical Structure ✅ 1. Strong Primary Uptrend The sequence on the chart is very healthy: Strong impulsive rally from ₹12,000 to ₹18,000 Sideways consolidation Attempting breakout This is classic trend → consolidation → trend continuation behavior. ✅ 2. Rectangle Consolidation The highlighted box represents roughly: Resistance: ₹18,900–19,000 Support: ₹16,900–17,000 The stock has spent nearly two months absorbing supply without giving up much of its previous gains. That's a sign of strength rather than weakness. ✅ 3. Breakout Attempt Current price: ₹19,028 This is right at the top of the consolidation range. A decisive close above ₹19,000 confirms the breakout. The candle shown is encouraging because it: Closed above resistance. Is a relatively strong bullish candle. Suggests buyers are regaining control. ✅ 4. Tight Consolidation Near Highs One of the strongest bullish characteristics is that the stock did not correct deeply after its previous rally. Instead, it moved sideways. Institutional leaders often behave this way. Measured Move The height of the range is approximately: ₹19,000 − ₹17,000 = ₹2,000 Adding this to the breakout level: ₹19,000 + ₹2,000 = ₹21,000 This aligns closely with the arrow you've drawn.