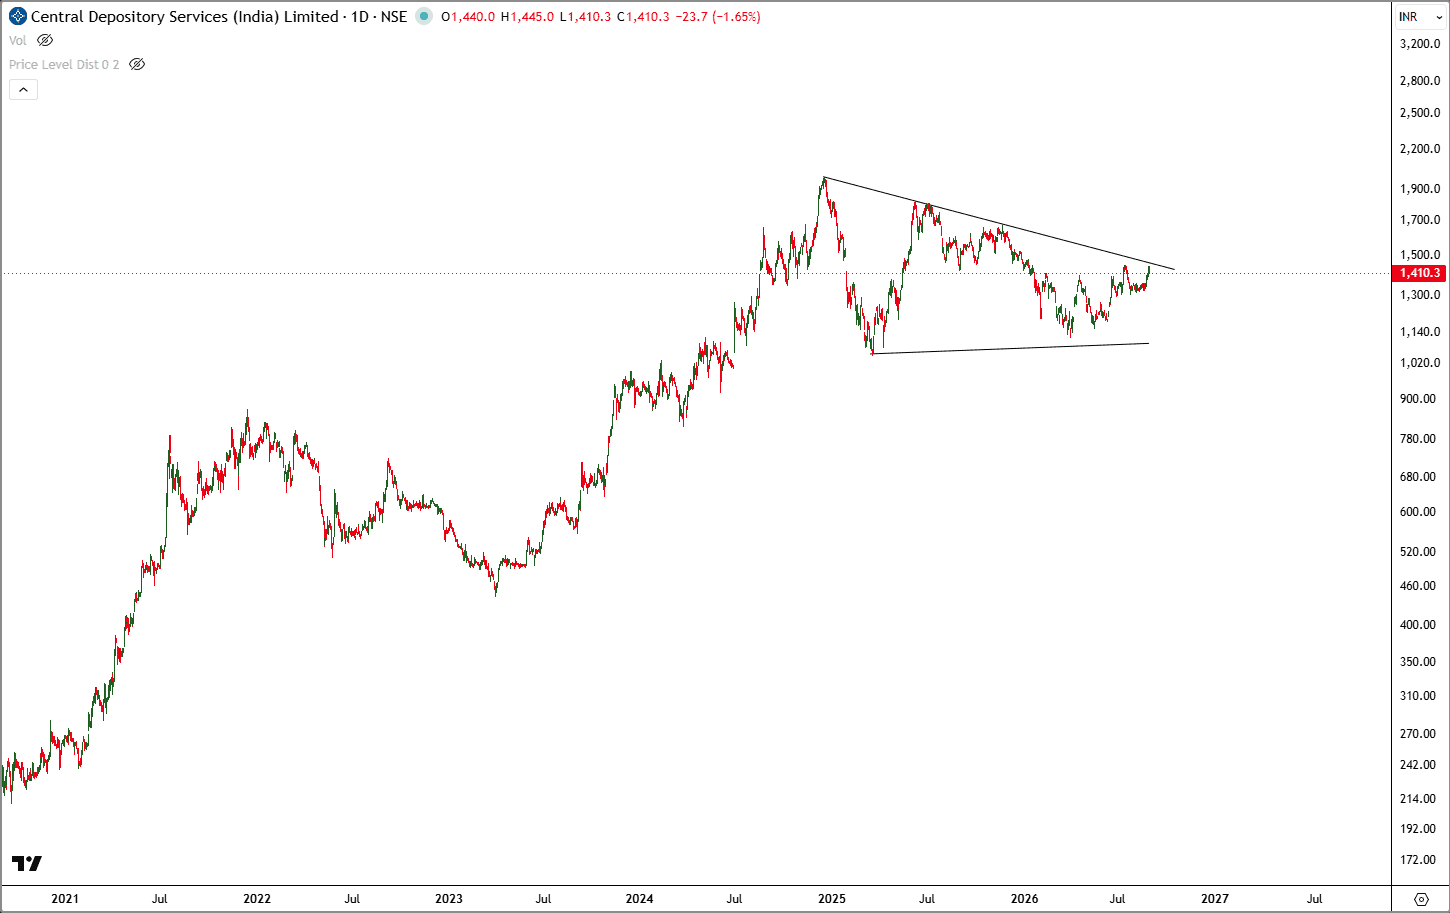
CDSL - About Breakout from a Triangle on daily chart
Technically,
ICDSLTD
, the stock is at an important inflection point. After peaking near ₹2,000, CDSL has been consolidating within a broad Symmetrical Triangle, with a descending resistance trendline connecting the major highs and a gradually rising lower trendline providing support. The stock is currently around ₹1,410 and is approaching the upper boundary near ₹1,450–1,500. A decisive breakout above this descending trendline can confirm a bullish resolution and potentially revive the move toward ₹1,600, ₹1,750 and ₹1,900. On the downside, ₹1,350–1,300 is the immediate support zone, while the rising trendline near ₹1,150–1,200 represents the major structural support. Overall, fundamentals remain constructive, but technically the stock needs a sustained breakout above ₹1,450–1,500 to signal the next major leg higher.