M&M: Ichimoku Setup Shows the Correction Is Still Active
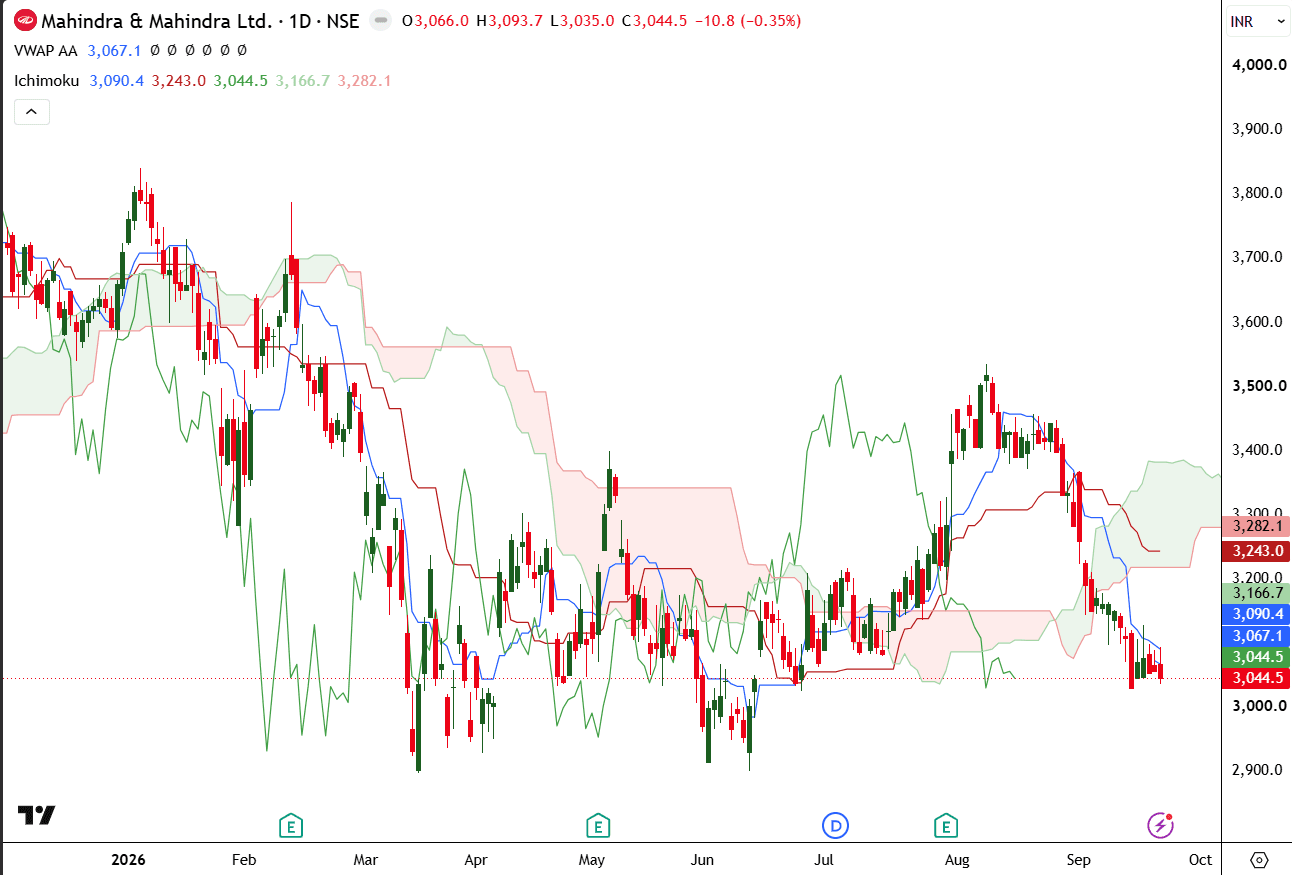
M&M closed at ₹3,044.50 on the daily chart, down 0.35%. The stock has retreated sharply from its August high near ₹3,525 and is now testing the ₹3,000–₹3,050 area, a zone that has acted as support earlier in the year.
The Ichimoku reading remains weak. Price is below the anchored VWAP at ₹3,067.10, showing that recent buyers are still marginally underwater. It is also below the Tenkan-sen at ₹3,090.40 and well below the Kijun-sen at ₹3,243. This gap between the faster and slower Ichimoku lines reflects the speed of the recent decline.
The cloud is positioned overhead between approximately ₹3,166.70 and ₹3,282.10. A cloud above price is a key sign that the prevailing trend is corrective rather than bullish. It also creates a layered resistance zone: ₹3,067 is the first test through VWAP, ₹3,090 is the next through Tenkan-sen, and ₹3,167 is the lower cloud boundary. A recovery through these levels would show that selling pressure is easing, while a move above ₹3,243 would be a more substantial improvement.
₹3,000 is the immediate support. A decisive break below it could bring ₹2,900 and then the March low zone near ₹2,850 into focus. The stock may be close to a tradable support area, but the indicators do not yet confirm a reversal. The technical trigger would be price reclaiming ₹3,090 and beginning to close above the VWAP.
M&M retains its structural appeal through its presence in SUVs, tractors and rural-linked demand. On this chart, though, the emphasis should remain on support holding first and momentum recovery second.
#WatchOutFor#StockInNews#Today’sTradingSetup