‹ All Posts
Dhwani Patel

16 hours ago · SEBI Registration INH200008608

Supreme Industries - Reading a downtrend line for two years
SUPREMEIND
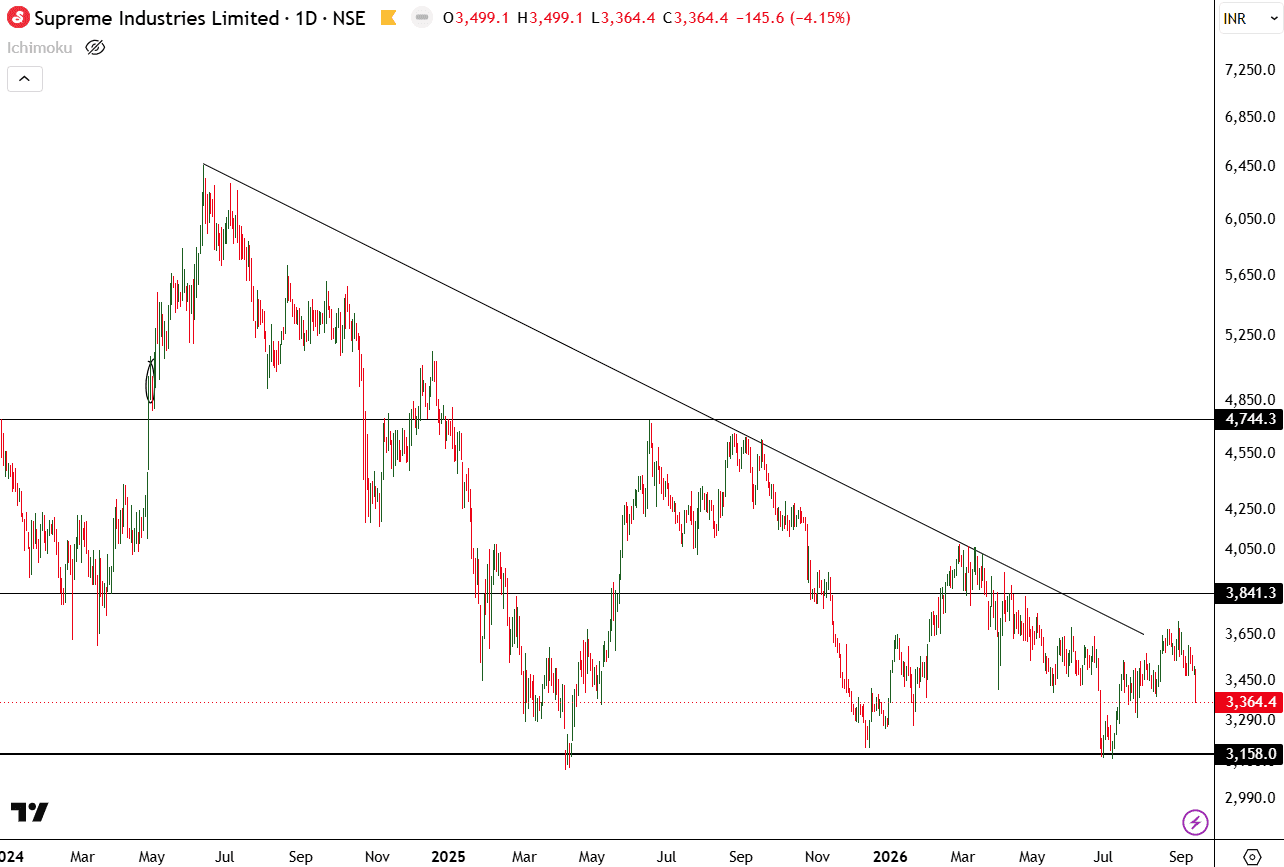
closed at 3364.40, lower by 145.60 or 4.15%. The session opened at 3499.10 and made its low at the close, which indicates selling that persisted through the day rather than a single shock. The structure on this chart is worth studying carefully, because it demonstrates how a descending trendline works over a long horizon. The line originates at the May 2024 high near 6450 and connects each successive lower high through 2024, 2025 and into 2026. Note what happened in March of this year. Price rallied to approximately 4050, touched the line, and was rejected. That marked the fourth occasion on which the same line contained an advance. Two horizontal levels frame the current range. The 3841.30 level has capped rallies repeatedly since late 2025. The 3158.00 level marks the July low and represents the lower boundary. Today's close at 3364.40 sits closer to the lower boundary than the upper one. The distinction a learner should draw here is between a trendline break and a level break. A trendline that has held four times carries more weight than one tested twice. Conversely, its slope means the level required to break it declines with every passing week, so time is working in favour of an eventual break even without a strong rally. On the business side, Supreme operates across plastic piping, packaging and industrial products. Piping volumes track agricultural and housing demand, while PVC resin price movements create quarter to quarter margin swings that the market watches closely. Falling resin prices often cause channel destocking, which suppresses reported volumes even when end demand is stable. A sustained move above 3841.30 would break both the horizontal level and the trendline. A close below 3158.00 would extend the two-year decline.

#MacroViews#Miscellaneous#EquityResearch
Screenshot 2026-09-12 083844.png
244 likes·88 comments