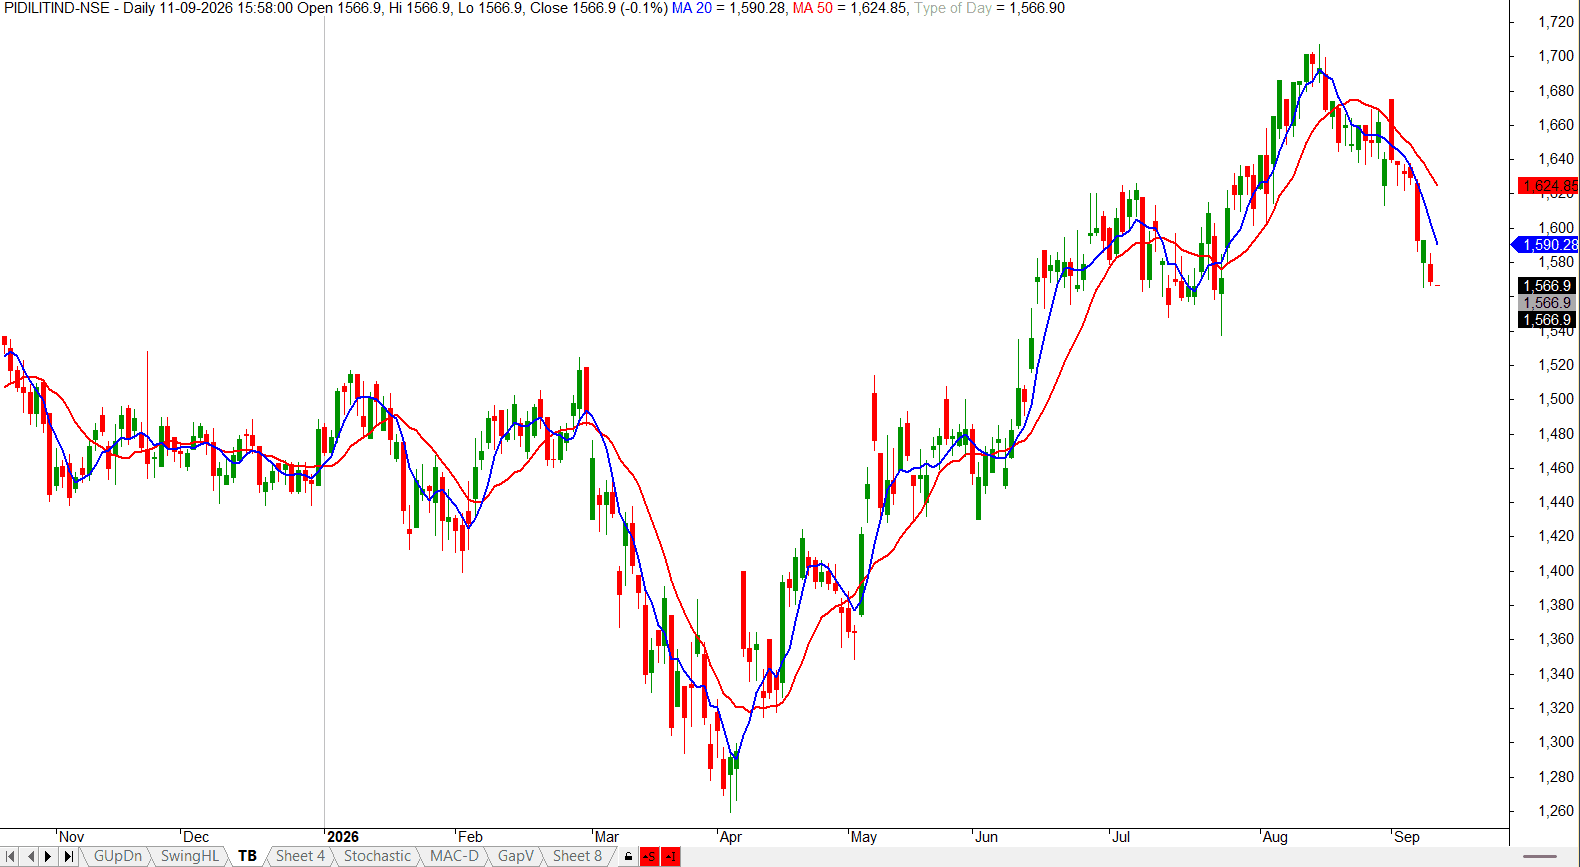
is at 1566.90, more or less flat on the day. The 20 MA is at 1590.28 and the 50 MA at 1624.85.
I want to use this chart to show you what the beginning of a change looks like, because it's a lot less dramatic than most people expect.
Walk through the last five months. In May the stock came off the 1260 area and started climbing. Through June and July, price stayed above the blue 20 and the blue stayed above the red 50. Textbook. Every small dip got bought near those lines.
Then August happened. The stock made its high near 1710 and started slipping. The 20 MA turned down first, which is normal because it reacts faster. Now look at the right edge of the chart. The 50 MA has also rolled over and started curving down. That's the part worth noticing.
One average turning down is a pullback. Both of them turning down, with price under both, is a change in the short-term trend. Not a disaster, not a prediction of a crash, just a different phase from the one we had in July.
Here's the practical bit. Price is at 1566.90 and the 20 MA is at 1590.28. So the stock is only about 23 points under its short average. That's a shallow decline so far. The larger question is whether buyers show up around 1540 to 1560, where the June consolidation sat, because old consolidation zones often become the first place a falling stock finds interest.
Pidilite is a consumer-adjacent business with adhesives demand tied to construction and renovation activity, so it tends to be steady rather than exciting, and its pullbacks tend to be orderly.
Reclaiming 1590 puts the shorter trend back in balance. Losing 1540 opens up the June range below.