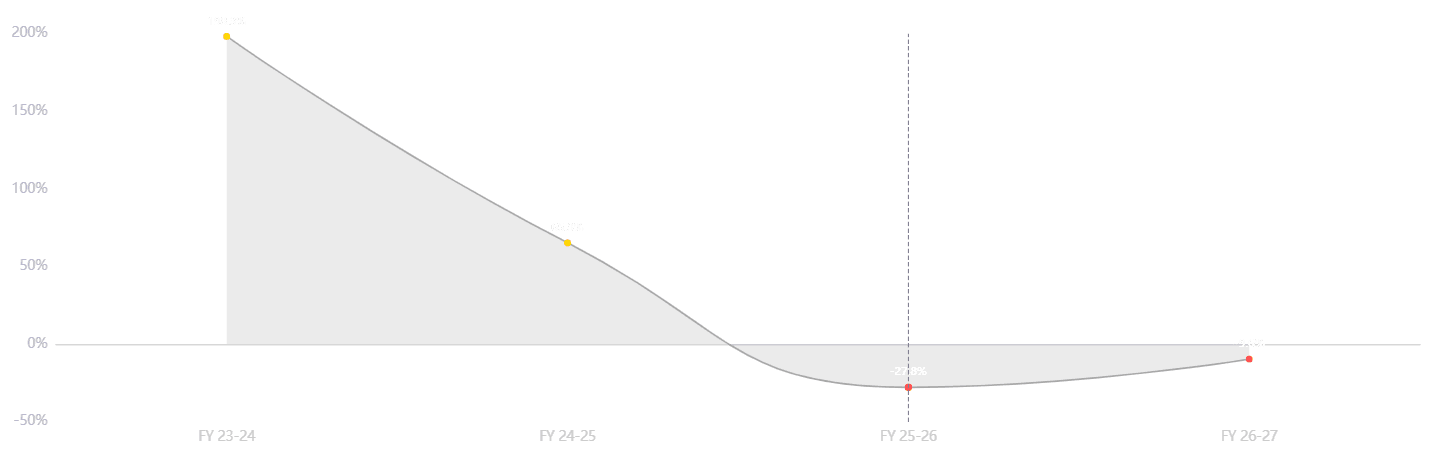
Kaynes From 198% Returns to Corrective Market Cycles
KAYNES
When I looked at the stock’s performance over the last few years, one thing that immediately stood out to me was the huge change in returns across different financial years.
The stock delivered an impressive 198.3% return in FY 2023–24, followed by another strong 63.5% return in FY 2024–25. But after that, the trend changed significantly. In FY 2025–26, the return turned negative at -27.8%, and the current FY 2026–27 performance shown in the data is around -9.6%.
So, what I observed is that the stock moved from a very strong performance phase into a correction and consolidation phase.
Now, when I studied the RSI along with the price movement, I found something interesting. RSI was not continuously moving into extreme overbought or oversold zones. Instead, it was repeatedly moving between different momentum zones and giving an indication of how the strength of the stock was changing.
For me, the 50 level on RSI becomes an important reference point. When RSI moves and sustains above 50, momentum starts improving, whereas repeated movement below 50 indicates weakness. The important point is that RSI should not be looked at independently—it becomes much more useful when I compare it with the actual price structure and trend.
My Observation
The biggest learning from this data is that historical returns can change dramatically with the market cycle. RSI helps me identify that change in momentum much earlier when I combine it with price action rather than using RSI as a standalone indicator.