‹ All Posts
Manjushri Sharma SEBI RA

2 hours ago · SEBI Registration INH000019497

NBCC Demand Zone Emerges After Prolonged Correction
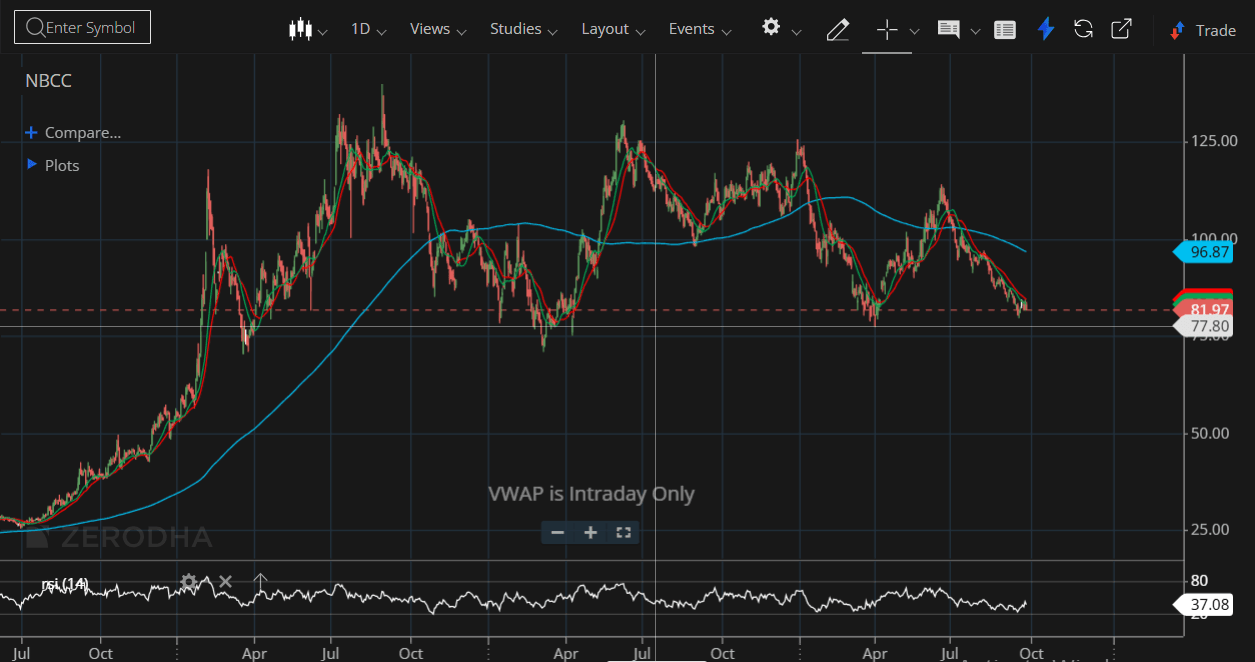
NBCC
is currently trading around ₹82.20 after a prolonged corrective phase. The chart indicates that the stock has gradually declined from the ₹110 zone and is now approaching an important demand area around ₹82–80. This zone becomes significant because price is showing signs of consolidation after the extended decline. A demand zone represents an area where buying interest may emerge and potentially limit further downside. However the presence of demand alone should not be considered a confirmation of reversal. Traders should watch for a bullish candle improving volume and a higher-low formation before considering a meaningful recovery. The recent price action shows repeated attempts to stabilise around the ₹82 level. If buyers successfully defend this area the first indication of strength would be a move back above the immediate resistance zone followed by a recovery toward higher levels. From a technical perspective the setup can be monitored through: Demand Zone → Price Stabilisation → Volume Confirmation → Higher Low → Breakout On the other hand a decisive breakdown below the demand zone would weaken the setup and could indicate continuation of the existing bearish structure. The key takeaway is that ₹80–82 is an important area to monitor for NBCC. Rather than anticipating a reversal solely because price has reached the demand zone traders should wait for confirmation that buyers are actually returning. A demand zone is an area of opportunity not a guarantee of reversal. Disclaimer: This article is for informational purposes only and should not be construed as investment advice or a recommendation to buy or sell any security. Market investments are subject to risk. Disclaimer : *****

#FundamentalViews#TechnicalViews#EquityResearch#StockInNews#MacroViews
nbcc.png
36 likes·35 comments