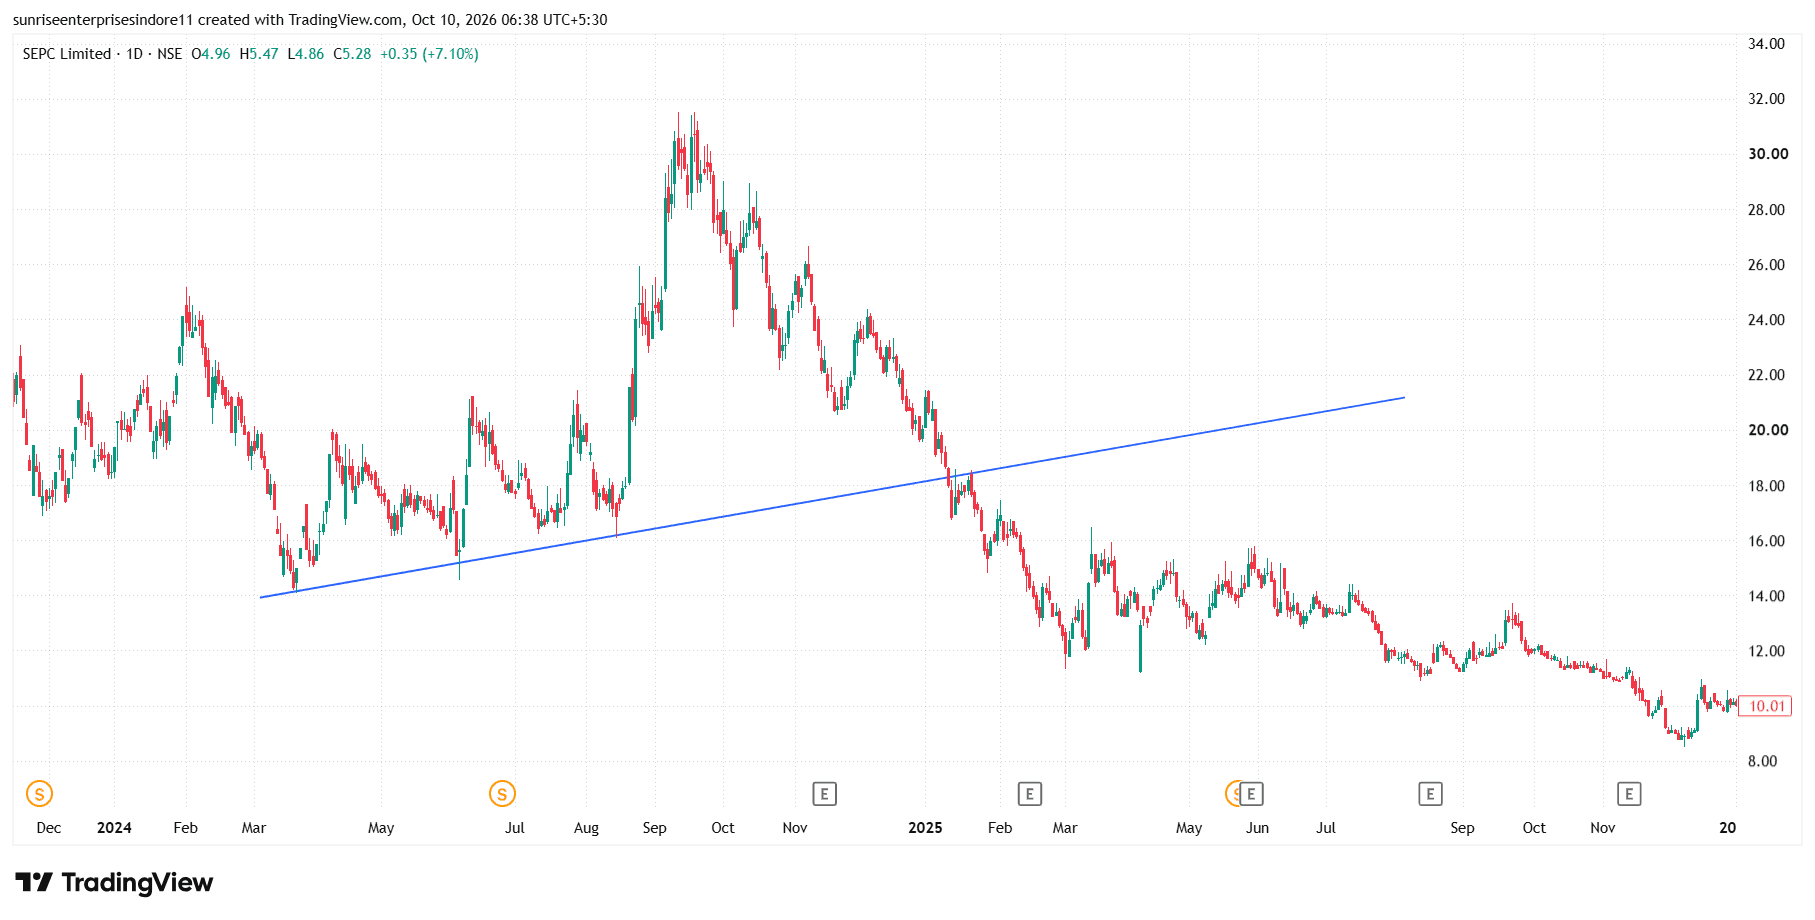
SEPC Limited demonstrates a classic trendline breakdown
SEPC SEPC Limited demonstrates a classic trendline breakdown, retest, and further downside pattern. Initially, the rising trendline acted as a support zone, where buyers repeatedly entered and attempted to maintain the bullish structure. However, in early 2025, the price decisively broke below this trendline, indicating that buying momentum was weakening and sellers were gaining control. After the breakdown, the stock continued to decline, and the former trendline support failed to act as a strong recovery base, confirming a bearish shift in market structure. This concept is important because once a major support trendline breaks, the same area can potentially become resistance, as traders who bought earlier may sell during a recovery and fresh sellers may enter near the broken trendline. SEPC subsequently continued to form lower highs and lower lows, reinforcing the broader downtrend visible on the chart. The key lesson is that a breakdown followed by a weak retest and renewed selling can strengthen bearish confirmation, although traders should look for price-action and volume confirmation rather than assuming every breakdown will lead to further declines. Chart shared for educational purposes only; not investment advice.