Zensar Technologies — Technical Analysis
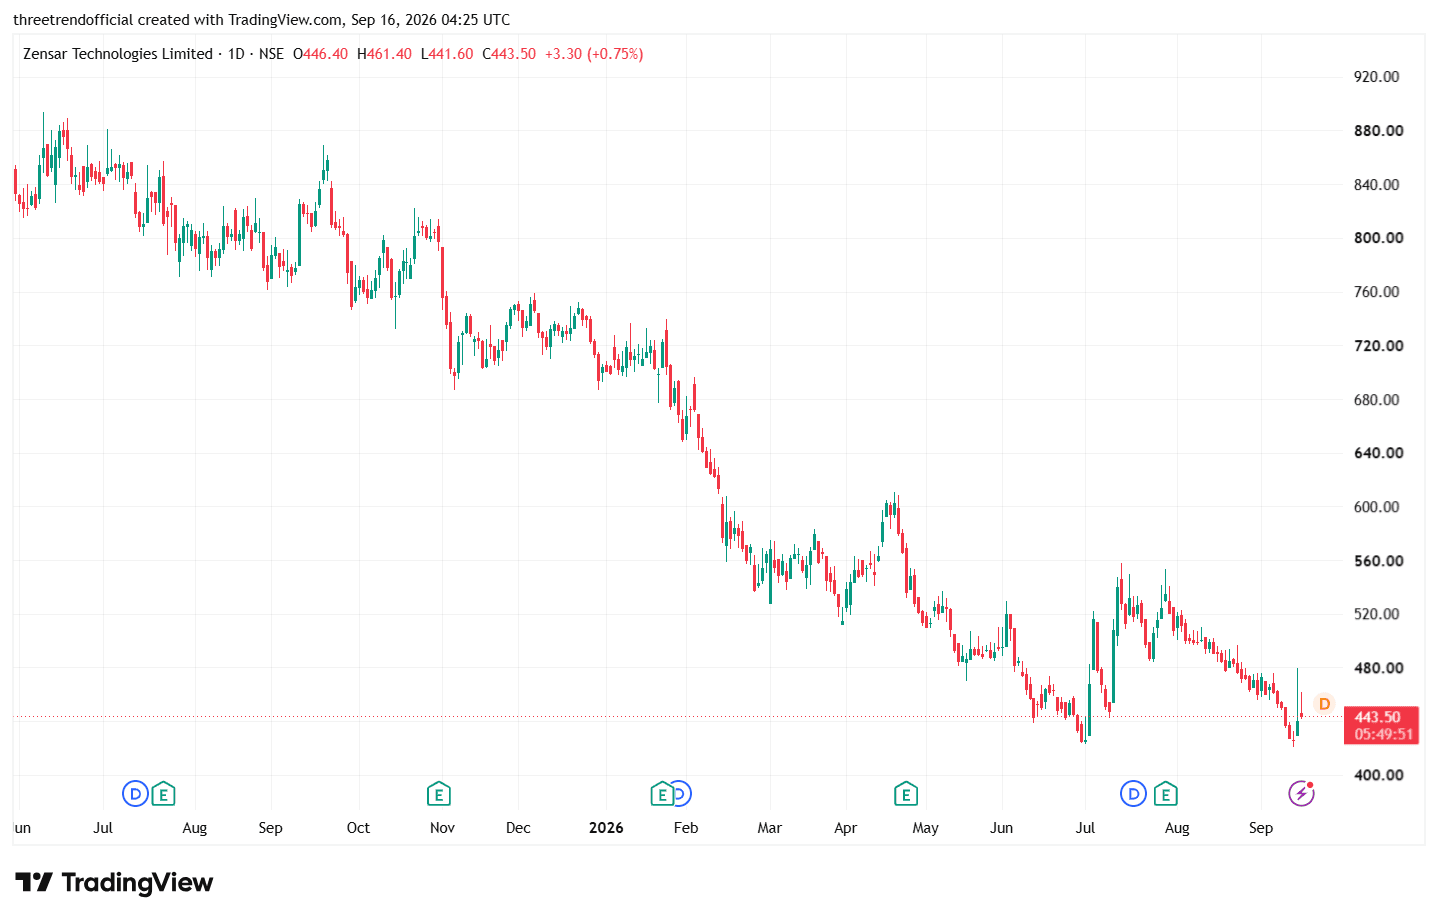
The chart shows that Zensar Technologies is still in a broader downtrend, with a clear sequence of lower highs and lower lows. After falling from the ₹800+ zone, the stock has recently declined toward the ₹420–₹445 area, which is close to the current 52-week-low region; market data shows a 52-week low around ₹421.
₹420–₹430: Important support/demand zone
₹440–₹450: Immediate resistance
₹480–₹500: Important resistance zone
₹520–₹550: Stronger resistance/supply zone
The immediate technical structure will improve if price forms a higher low around ₹420–₹430 and then breaks above ₹480–₹500 with volume. Conversely, a decisive breakdown below ₹420 would indicate continuation of the existing downtrend.
Fundamentally, Q1 FY27 revenue grew 8.9% YoY to ₹1,508 crore, while PAT was ₹183.8 crore; however, operating profit declined sequentially, so earnings momentum still needs monitoring.
In one line: Zensar is near a crucial ₹420–₹430 support zone; a bullish reversal from this area could indicate the formation of a base, while a breakdown below it would keep the lower-high/lower-low structure intact.