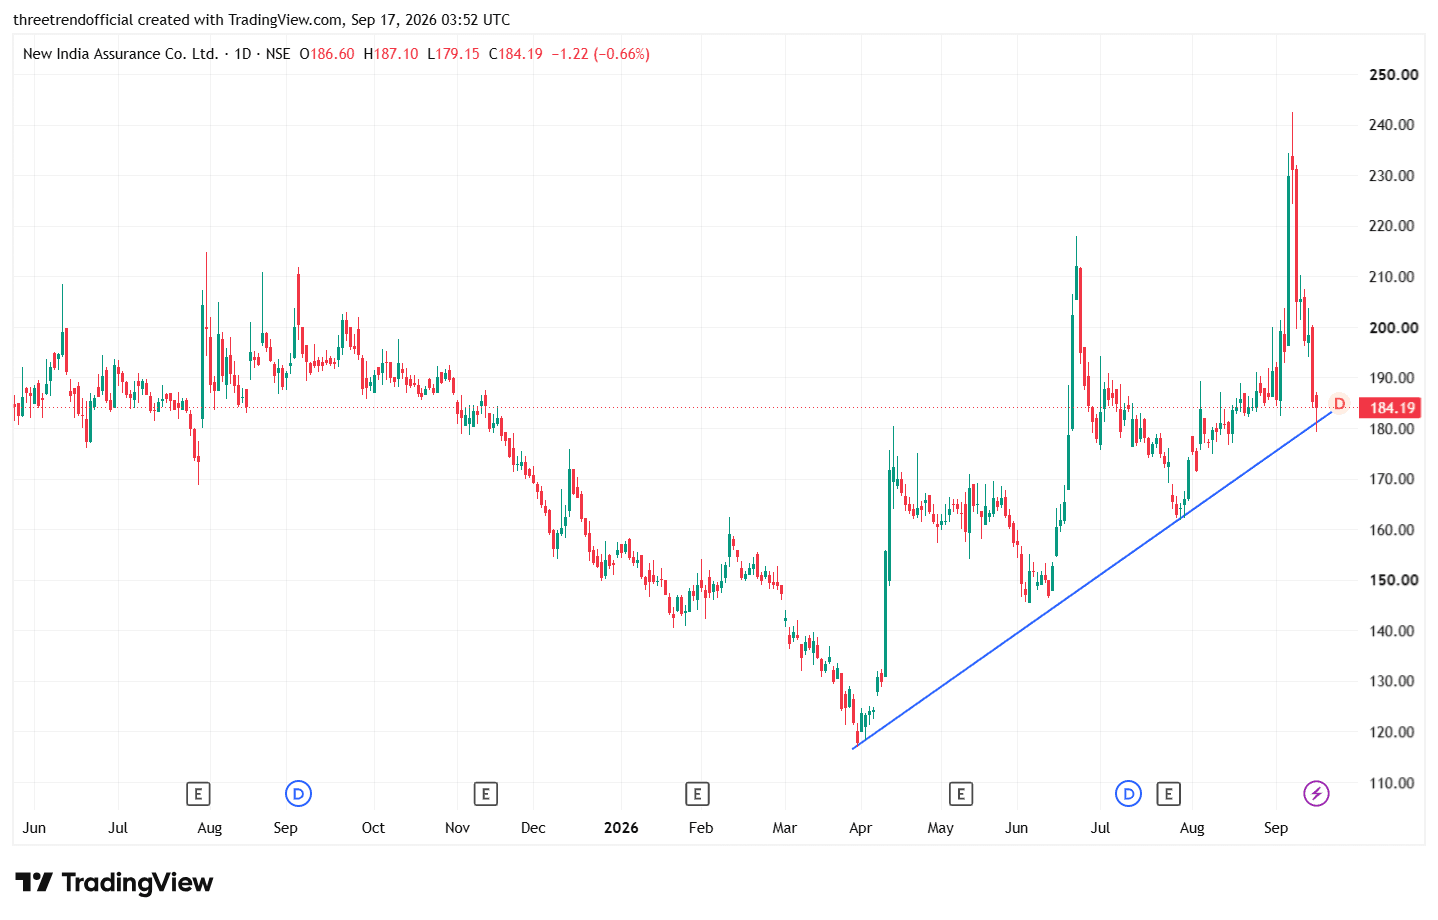
trong rising trendline from the April low near ₹117,
NIACL
The chart shows a strong rising trendline from the April low near ₹117, with successive higher lows. After the sharp rally toward ₹242–₹243, the stock has undergone a steep correction and is now around ₹184, bringing it back close to the rising trendline support. Recent data confirms the stock closed at ₹184.19 on September 16 after falling 6.54% on September 15 and another 0.66% on September 16.
₹180–₹185: Important trendline/support zone
₹175–₹180: Next support if ₹180 breaks
₹195–₹200: Immediate recovery resistance
₹205–₹212: Stronger resistance zone
₹230–₹243: Major previous supply zone
The ₹180–₹185 area is particularly important because it combines the rising trendline with the recent price structure. Technical data also places support around ₹180 and ₹174, while the 50-day moving average is around ₹184.