ABB
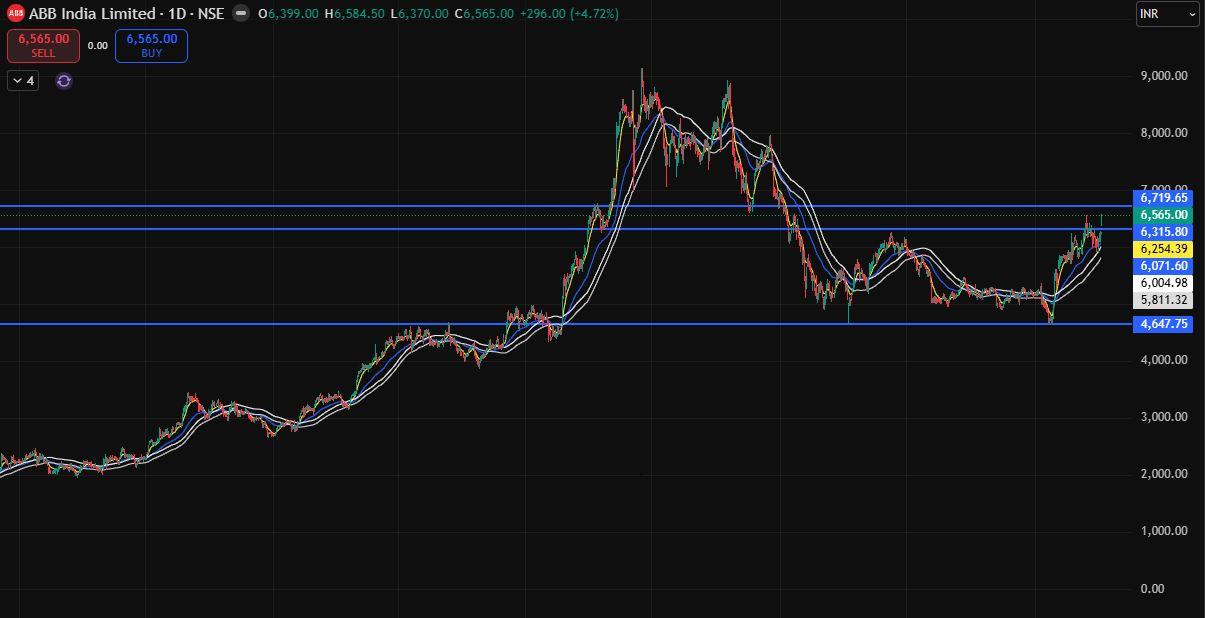
The daily chart of ABB India Limited presents a compelling technical setup, where price has transitioned from a prolonged consolidation base (₹4,647–₹6,000) into a potential expansion phase, now testing a critical resistance zone between ₹6,300–₹6,700; the recent reclaim of moving averages along with the formation of higher lows reflects strengthening bullish structure and underlying demand, yet confirmation remains dependent on a decisive breakout, as a sustained move above ₹6,700 with strong price action could trigger momentum buying and continuation toward ₹7,200–₹8,000, with moving averages likely acting as dynamic support, while failure to break this supply zone may lead to rejection and a pullback toward ₹6,000 or even ₹5,800, keeping the price within a broader range; notably, the current compression near resistance indicates a build-up of pressure, which in price action terms often precedes a sharp volatility expansion, suggesting that a significant directional move may be imminent. Disclaimer: This analysis is for educational purposes only and should not be considered financial advice or a recommendation to buy or sell any security.