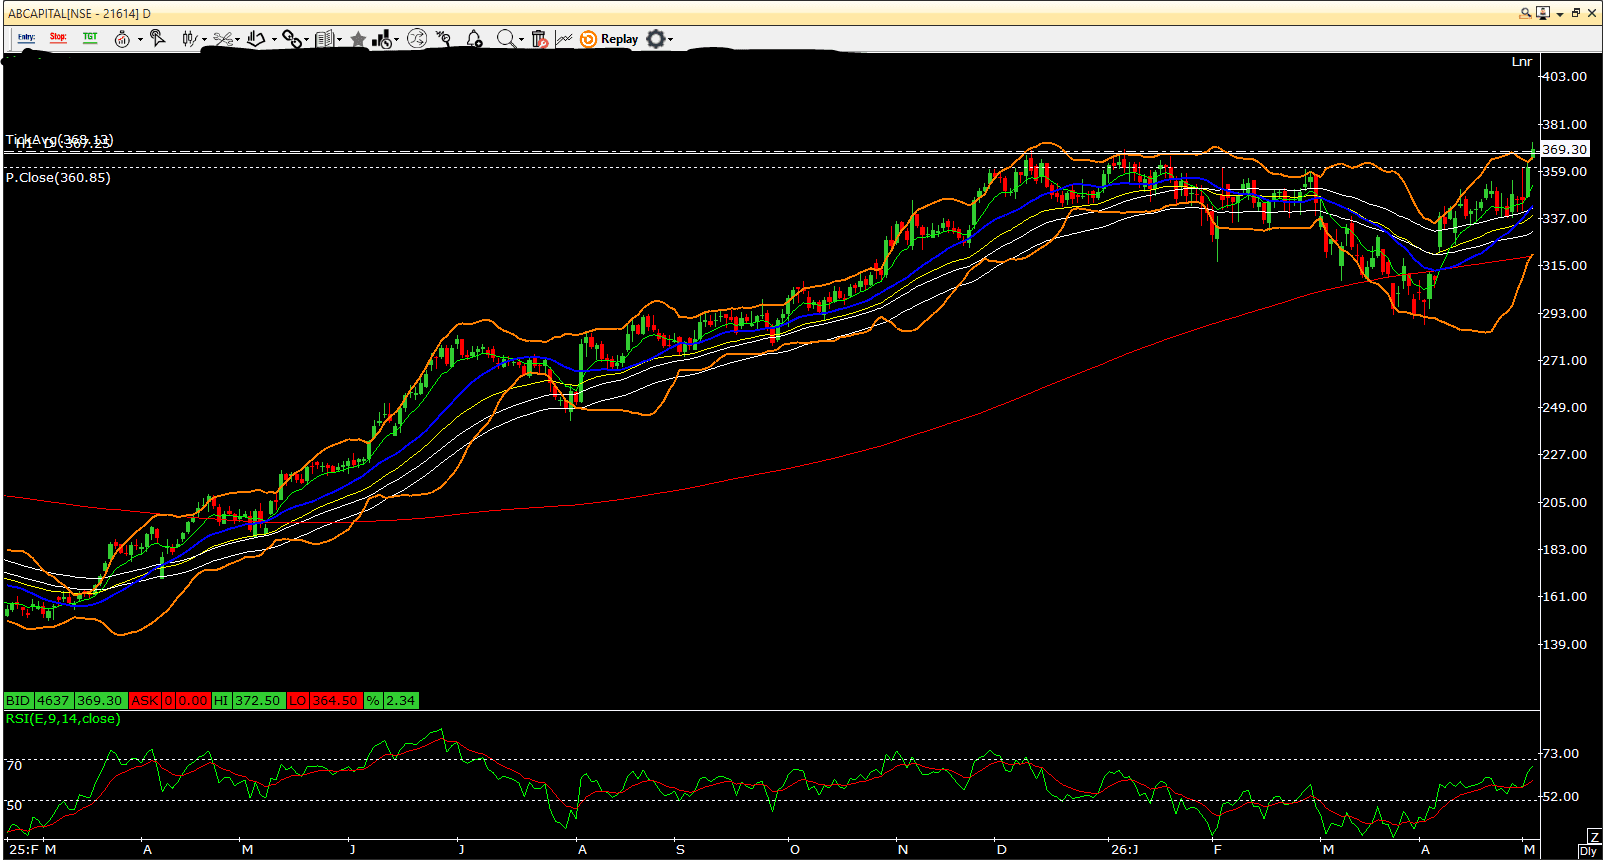
ABCAPITAL - Chart Analysis
ABCAPITAL has witnessed a strong breakout on the daily chart after moving above the important resistance zone near 360–365. The stock had been consolidating around this range for several sessions, and the recent move indicates improving momentum along with stronger buying interest. The breakout has also pushed the stock toward fresh swing highs, reflecting a positive price structure in the near term. Technically, the stock continues to trade above its key short-, medium-, and long-term moving averages, which highlights the strength of the prevailing trend. The upward slope in moving averages and expansion in Bollinger Bands suggest increasing momentum, while RSI has also moved above the neutral zone, supporting the improving setup. The earlier resistance zone around 360–365 may now act as an immediate support area going forward. Sustaining above this range could keep the broader trend structure positive, while the next important levels on the upside remain around 380 and the psychological 400 zone. Overall, the chart setup indicates strengthening momentum and continuation of the broader uptrend. However, this analysis is purely for educational and informational purposes based on technical chart patterns and should not be considered as investment advice or a buy/sell recommendation.