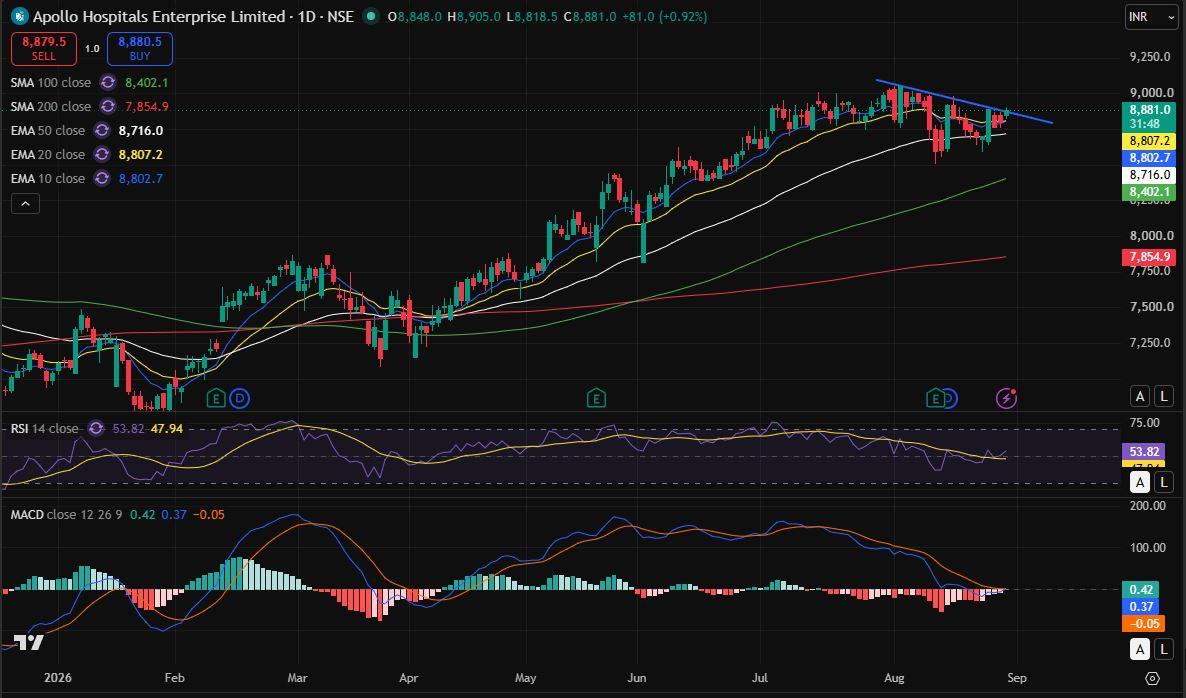
Apollo Hospitals Eyes Breakout Above Key Resistance
is showing a positive technical setup after recovering from its recent correction and moving back above the short-term moving averages. The stock is currently testing a descending trendline resistance, making the ₹8,900–₹9,000 zone crucial for the next directional move.
Technical View
CMP: ₹8,881 | Time Frame: Daily
The stock is trading above the 10-EMA (₹8,803), 20-EMA (₹8,807), 50-EMA (₹8,716) and 100-DMA (₹8,402), indicating that the broader trend remains positive.
RSI is around 54, suggesting balanced-to-positive momentum with sufficient room for further upside. MACD is showing signs of improvement, with the MACD line moving above the signal line, supporting a potential recovery in momentum.
Key Levels
Immediate Resistance: ₹8,900–₹9,000
Next Targets: ₹9,050 / ₹9,150 / ₹9,250
Immediate Support: ₹8,800
Major Support: ₹8,700–₹8,715
Strong Support: ₹8,400
Outlook
A decisive daily close above ₹9,000, preferably supported by strong volumes, could confirm a breakout from the descending trendline and trigger further upside towards ₹9,050 and ₹9,150, with ₹9,250 as the next major target.
On the downside, ₹8,800 is the immediate support zone. Holding above ₹8,700–₹8,715 would keep the short-term structure constructive. A sustained close below ₹8,700 could weaken the setup and lead to further consolidation.
Overall View: Moderately Bullish — A sustained breakout above ₹9,000 could strengthen the upside momentum.
This is a technical analysis based on chart structure and indicators, not a recommendation to buy or sell.
#TrendingSectors#SectorBreakouts#EquityResearch#PersonalFinance#TechnicalViews