BEML – Chart Speaks
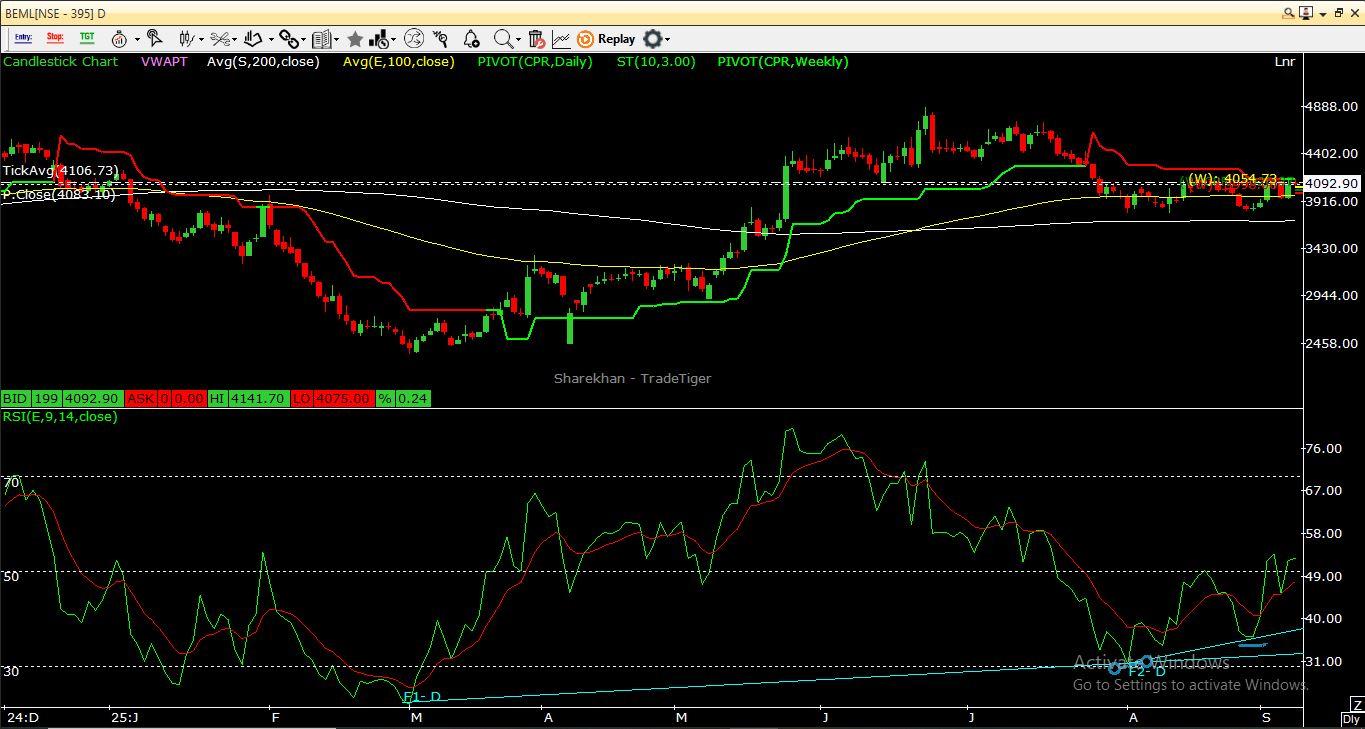
Weekly Chart Outlook Stock has corrected nearly 22% from recent swing high, finding strong support around ₹3,800. Price action suggests the formation of an inverted Head & Shoulder pattern: Left Shoulder and Head already completed. Right Shoulder is in the process of formation, with bottoms placed in the ₹3,500–₹3,800 support zone. The neckline is placed at ₹4,700, which becomes the first breakout target once confirmed. RSI has reversed from 50 levels, indicating fresh bullish momentum and suggesting that downside could be limited. Weekly View Conclusion: A structural base is forming with a potential long-term bullish breakout above ₹4,700. Daily Chart Outlook Since the first week of August, price has been range-bound between ₹3,800 (support) and ₹4,100 (resistance). Formation of a Double Bottom pattern: Base at ₹3,800. Neckline at ₹4,150. A decisive daily close above ₹4,150 will confirm the breakout and trigger the next leg of upside. Stop Loss: Below ₹3,800 (strong structural support). Upside Targets: ₹4,400 (first target) ₹4,550 (second target) Price is comfortably trading above 100 SMA and 200 SMA, reinforcing bullish bias. RSI divergence is visible, with higher lows on RSI while price made similar lows — a strong bullish signal. Daily View Conclusion: A breakout above ₹4,150 could open upside towards ₹4,400–₹4,550, with downside risk limited to below ₹3,800. ✅ Final Take: Weekly chart is showing a larger inverted H&S with ₹4,700 as the big breakout level. Daily chart provides a short-term setup with ₹4,150 breakout triggering an up-move towards ₹4,400–₹4,550. Risk-reward is favorable as long as ₹3,800 support holds. Disclosure I, and my immediate family members have no financial interest or beneficial ownership in the securities mentioned herein at the time of publication. Disclaimer Trading in the stock market involves risk This report is for informational purposes only and not investment advice.