BHEL - Chart Speaks
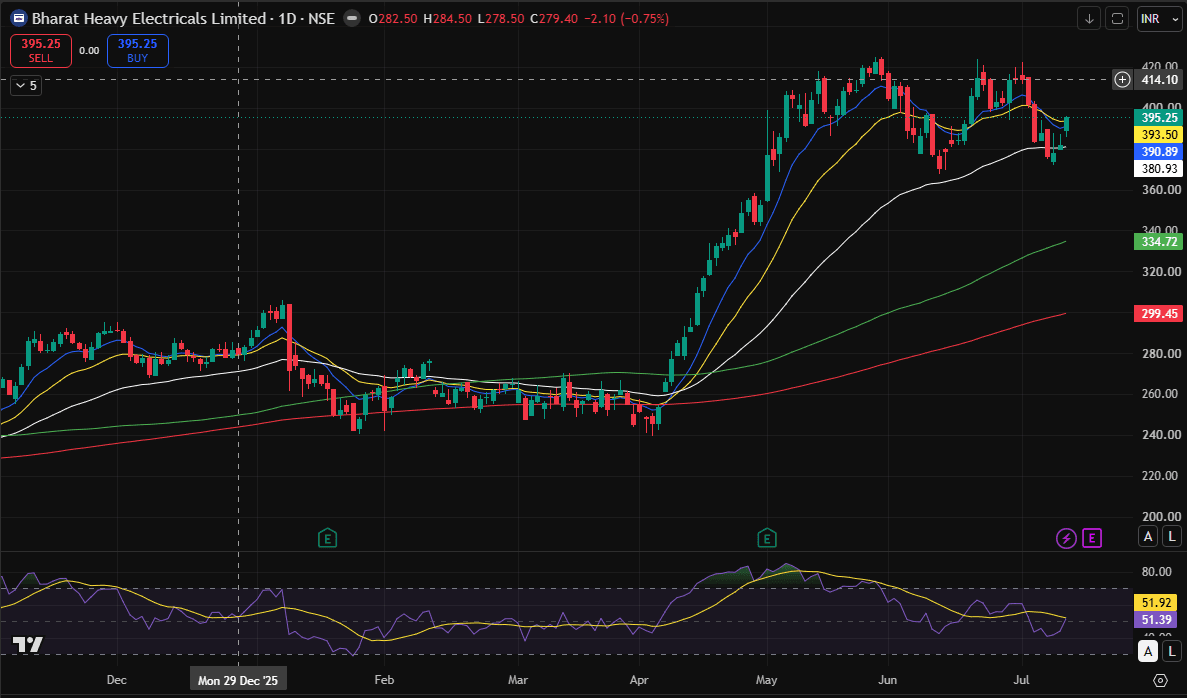
Bharat Heavy Electricals Ltd. (BHEL) continues to maintain its long-term bullish structure despite the recent corrective phase. The stock is trading above its 100-day and 200-day moving averages, indicating that the broader trend remains positive. However, in the short term, the price is facing resistance around the 20 EMA and 10 EMA, suggesting that momentum is yet to fully recover.
The recent pullback from the ₹420 zone appears to be a healthy correction rather than a trend reversal. The stock has found support near ₹380–385, where buying interest has emerged multiple times. RSI is hovering around the 50 mark, indicating neutral momentum with room for a move in either direction.
A sustained move above ₹395–400 could improve sentiment and open the door for a retest of ₹410–420. On the downside, ₹380 remains an important support level. A decisive break below this zone may increase selling pressure and could drag the stock towards ₹360–345.
Overall, the long-term trend remains constructive, while the short-term outlook is neutral with a positive bias. Traders may watch for a breakout above the immediate resistance for confirmation of fresh strength, whereas investors can monitor whether the stock continues to hold above its key support levels before expecting the next directional move.
This analysis is for educational purposes only and should not be considered investment or trading advice. Please do your own research before making any investment decisions.