CHAMBLFERT - In a Prolonged Consolidation
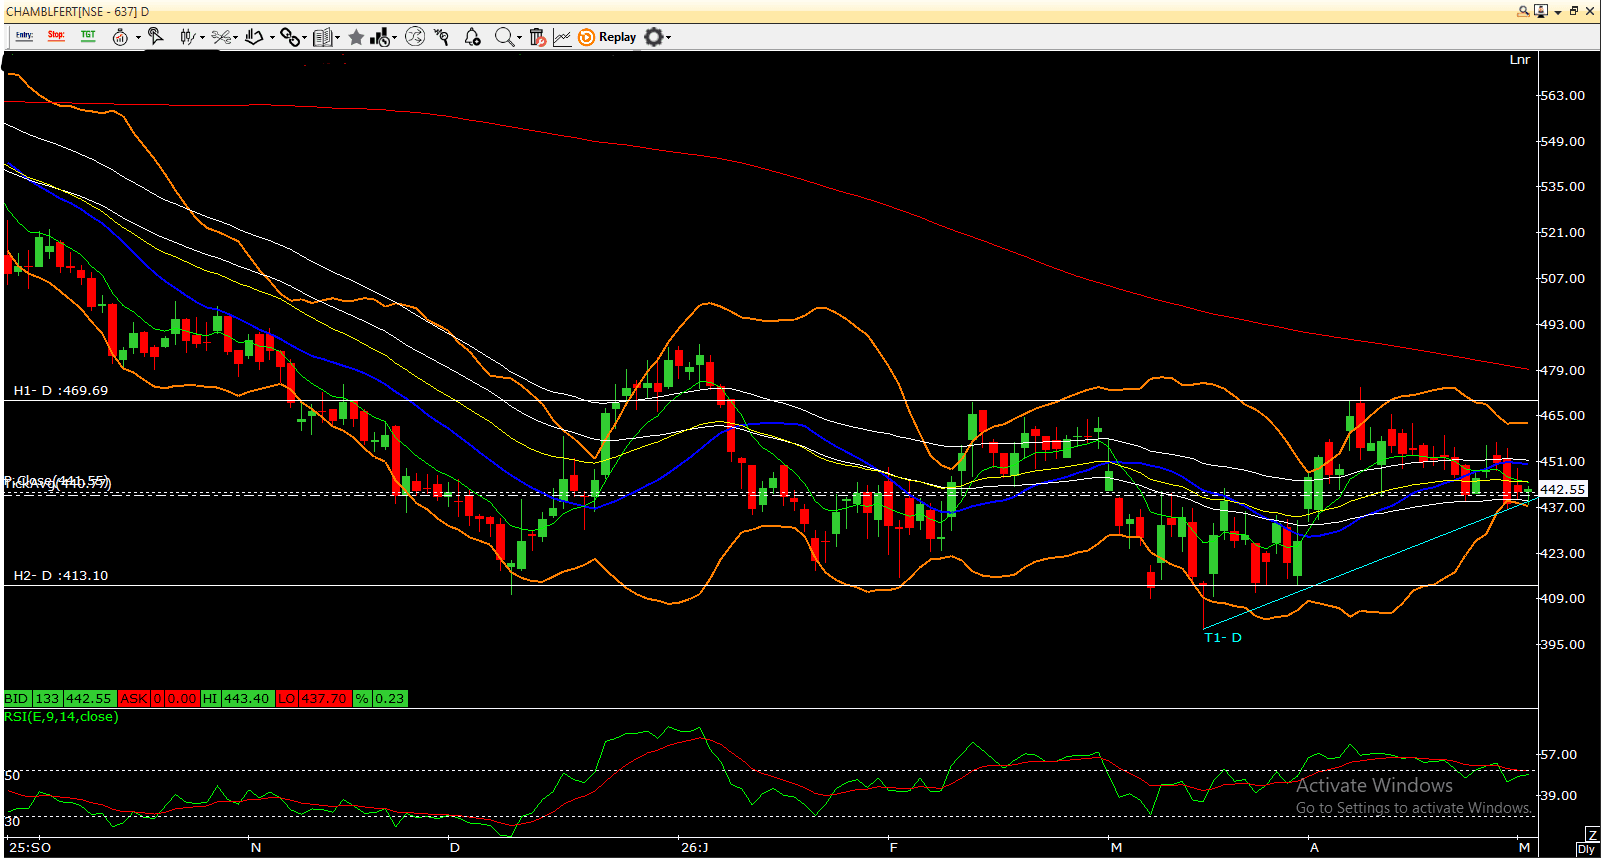
The chart of Chambal Fertilizers presents a well-defined consolidation structure that has been in place since December 2025, following a prior corrective downtrend. Price action is largely confined within a horizontal range, with strong support emerging around 410–420, where multiple declines have been arrested, indicating consistent buying interest at lower levels. On the upside, resistance is clearly visible in the 460–470 zone, where rallies have repeatedly stalled, suggesting supply pressure and profit booking. The current price hovering near the mid-zone around 440–445 reflects equilibrium, where neither bulls nor bears have established control.
From an indicator perspective, the Bollinger Bands have noticeably contracted, highlighting a significant drop in volatility and pointing toward a phase of price compression. This “squeeze” typically precedes an expansion phase, although it does not indicate direction. The moving averages (short- to medium-term) are flattened and frequently intersecting, which reinforces the lack of trend and confirms a sideways market structure. The longer-term average (200 EMA) remains above price and continues to slope downward slightly, indicating that the broader trend context is still cautious, even though price is attempting to stabilize beneath it.
The RSI is oscillating in the 40–60 range, reflecting neutral momentum with no clear overbought or oversold conditions. This behavior aligns with a consolidating market where price swings are contained and lack follow-through. Overall, the chart suggests that Chambal Fertilizers is in a mature consolidation phase, characterized by defined support and resistance, contracting volatility, and neutral momentum readings. While consolidation remains the dominant theme for now, the prolonged tightening of price and indicators indicates that the stock is gradually building pressure for a more decisive move once it breaks out of this established range.