CHART OF THE DAY - TARIL
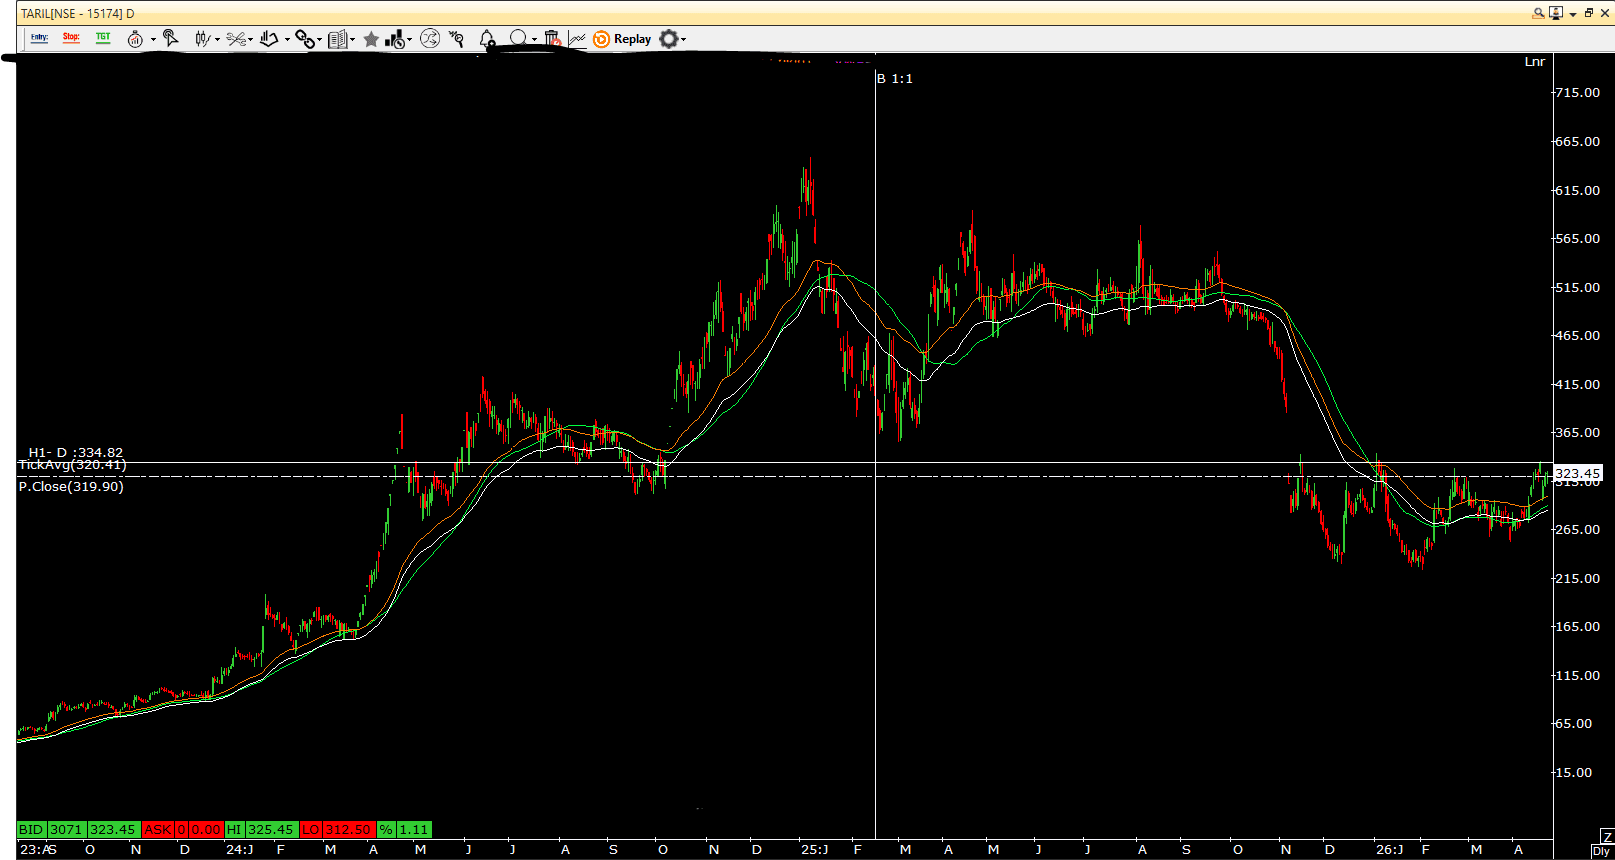
This TARIL chart is a perfect real-time lesson on Gap Theory meeting Structure, and ignoring either of them can cost you a clean move. Let’s start with the core—Gap Theory. A gap is not just empty space on the chart, it represents a sudden imbalance. In TARIL, the recent sharp downside gap clearly shows aggressive supply entering the market. But here’s where most traders go wrong—they assume trend will continue just because a gap appeared. In reality, gaps often act like unfinished business. Price has a tendency to come back and fill that void before deciding its next major direction. Now layer this with what TARIL is currently building. After the decline, the stock is no longer making fresh panic lows. Instead, it is forming a base structure that resembles an inverted head & shoulder—a classic reversal pattern. The key level here is the neckline around 335, which acts as the gateway between bearish control and bullish shift. But here’s the real edge—the story is not just about breaking 335. Even if TARIL gives a breakout above the neckline, the recent gap overhead must be fully filled. Why? Because until that gap is absorbed, supply is still active in that zone. A breakout without gap fill is often premature and vulnerable to failure. So the correct sequence to watch is: First → Price reclaims 335 Second → Moves into the gap zone Third → Fills the gap completely Fourth → Sustains above it Only then does the move shift from a technical possibility to a high-conviction reversal. This is where most traders lose patience—they buy the breakout, but ignore the gap. Professionals wait for confirmation through completion. The real lesson from TARIL: Patterns show intent, gaps show imbalance—but only when imbalance is resolved does a trend truly begin. Market doesn’t reward early guesses. It rewards those who wait for the story to finish.