Chart Speaks - Ashapura Minechem
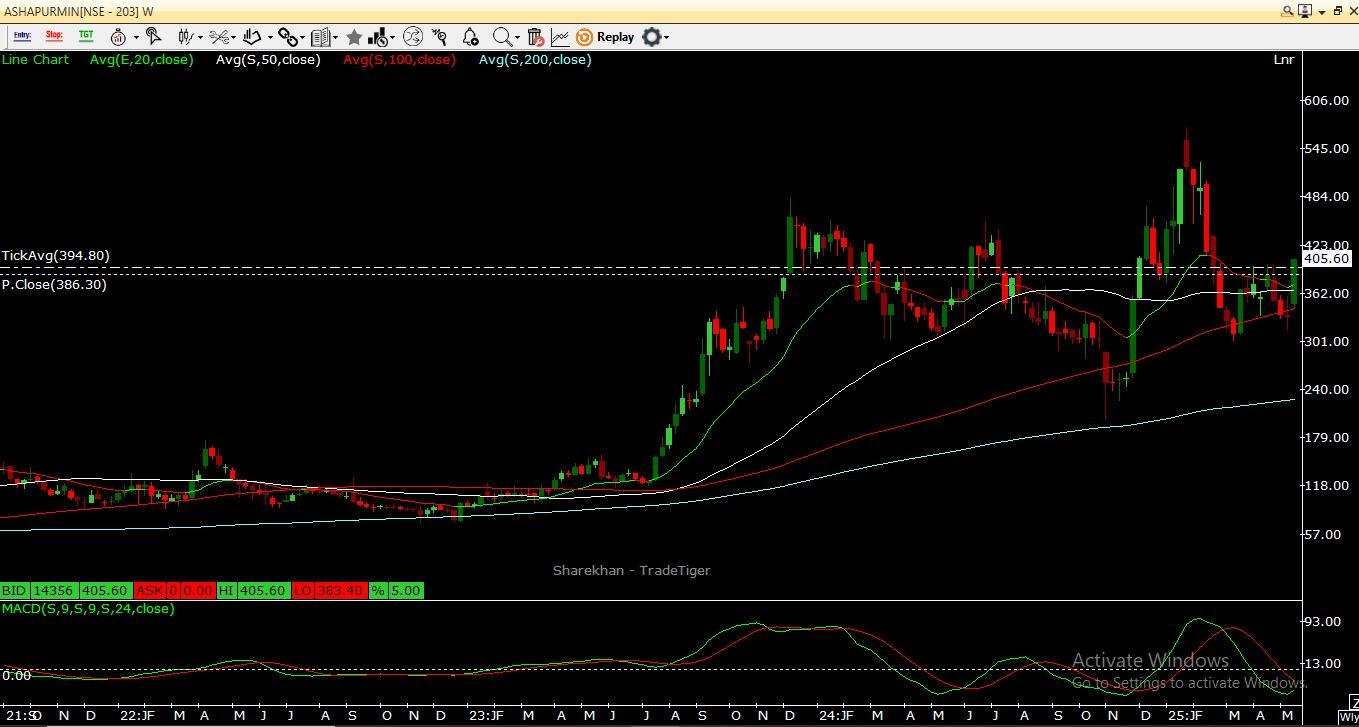
Ashapura Minechem Ltd is showing strong potential both technically and fundamentally, making it an attractive stock for investors looking for bullish opportunities. Below is a detailed analysis highlighting the key technical signals, fundamental strengths, and investment considerations: Technical Analysis: The chart for Ashapura Mines is exhibiting a bullish outlook. The price is currently trading above the 200-day simple moving average (SMA) on the weekly chart. Candles are forming a double bottom pattern, indicating a bullish formation. Price action suggests a higher high and higher low pattern on the weekly chart. Entry and Targets: Consider making an entry around the 400 levels. Target prices are set between 500 and 530. Implement a stop loss at 325 to manage risk effectively. Fundamental Analysis: Market Capitalization: ₹3,364 crore. Price-to-Earnings (P/E) Ratio: 14.60, indicating potential undervaluation. Return on Equity (ROE): 30.71%, reflecting strong profitability and efficient use of equity. Profit Growth: 44.10% over the past three years, showcasing robust growth in earnings. Debt Levels: Manageable debt-to-equity ratio, indicating a balanced capital structure. Quarterly Earnings Trend: Recent results show significant growth in revenue and profit after tax. Valuation Insights: The stock is trading below its intrinsic value, suggesting it may be a good investment opportunity. The price-to-book (P/B) ratio is around 4, which is reasonable given the company's growth prospects. Investment Considerations: The stock is part of the top 74% of companies with bullish price momentum, indicating positive market sentiment. Community sentiment is favorable, with many investors voting to buy or hold the stock. Disclaimer- Investment in the share market is subject to market risk, and past performance is not indicative of future results. Recommendations are for informational purposes only and should not be considered as buy or sell advice.