‹ All Posts
Pradeep Carpenter

22nd Jun 2025 · SEBI-Registered Analyst

Chart Speaks -
M&M

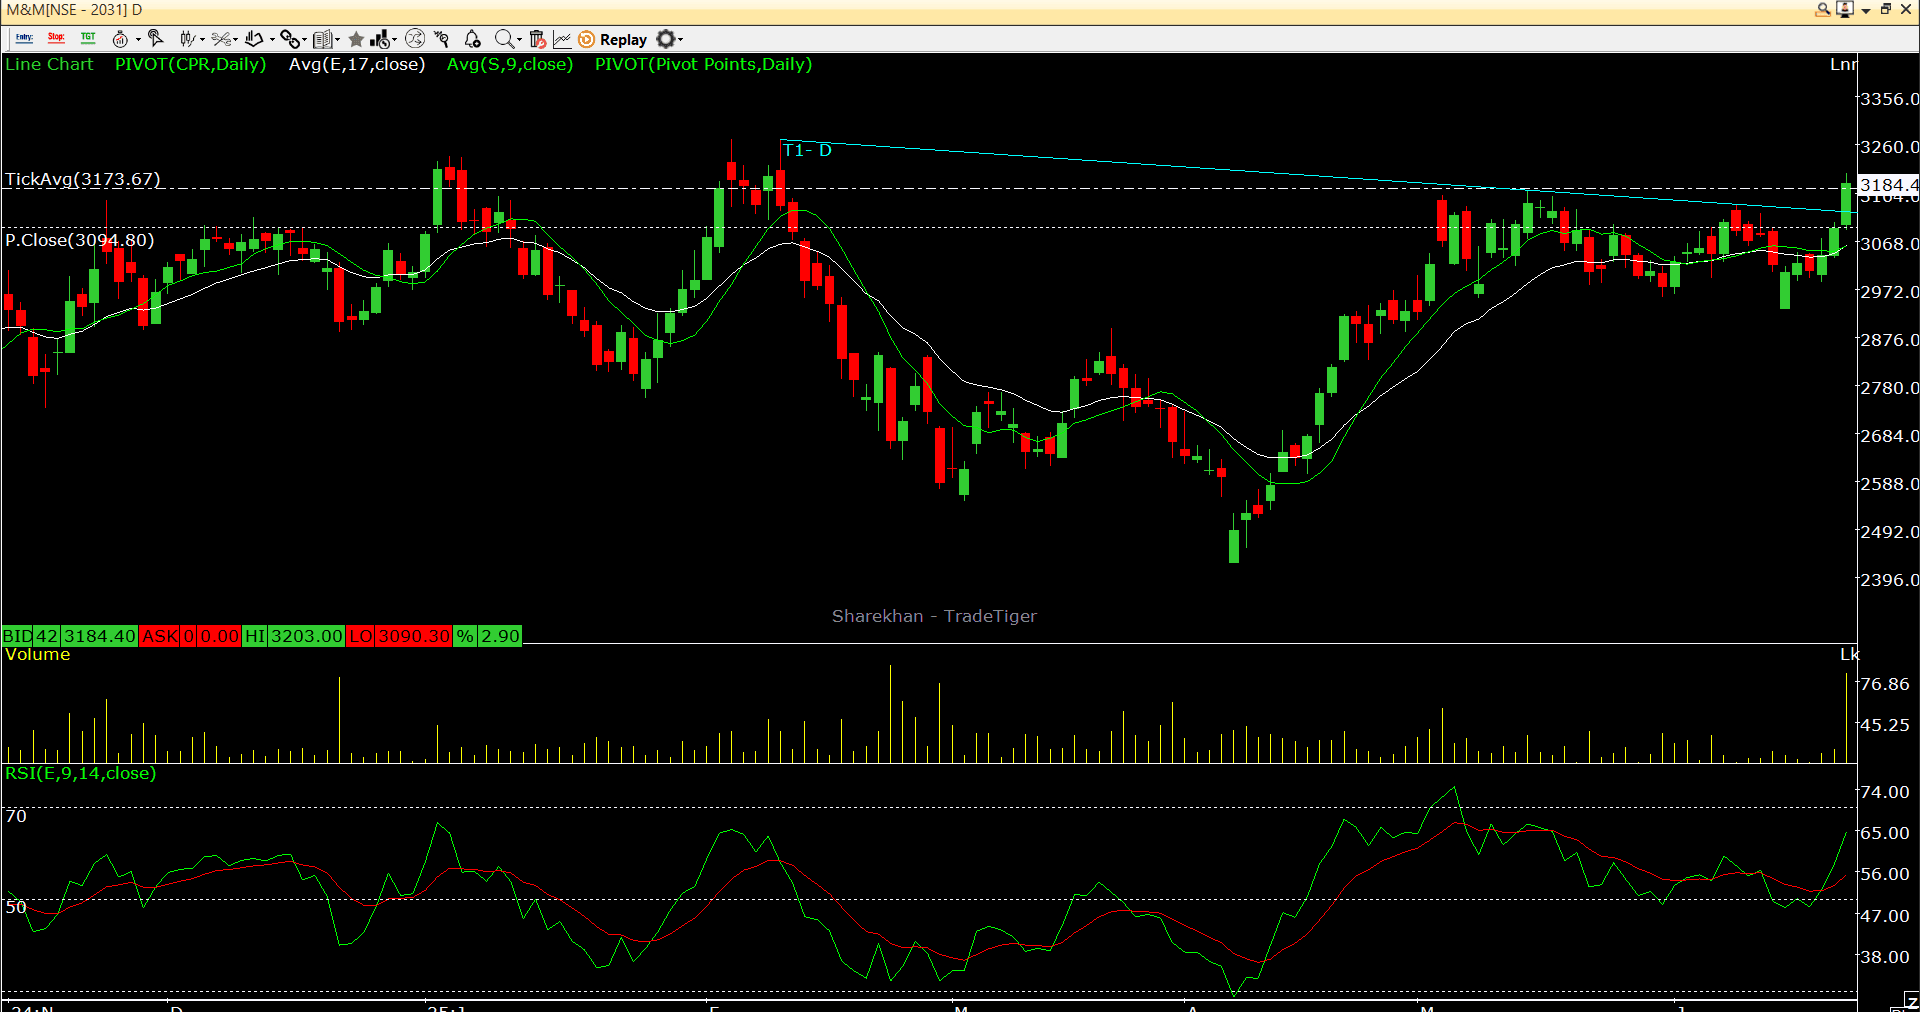
In recent market activity, the Nifty Auto index has shown significant strength, outperforming major frontline indices over the past week. This performance indicates a potential trend reversal, as the index approaches a critical trendline breakout. For Mahindra and Mahindra
M&M
, the stock has successfully broken through a downward-sloping trendline, accompanied by strong trading volume. This breakout is a positive signal, suggesting increased investor interest and potential upward momentum. Additionally, the daily Relative Strength Index (RSI), a momentum oscillator that measures the speed and change of price movements, has risen above the 60 mark. This indicates that the stock is gaining strength and may continue to rise. Key levels to note for M&M include: Accumulation zone: Rs 3,190 to Rs 3,160 Stop-loss level: Rs 3,060 Potential upside target: Rs 3,400 This analysis highlights important technical levels and indicators for educational purposes, providing insight into market behavior and stock performance. Disclaimer- As a SEBI registered Research Analyst with NISM certification, I want to emphasize that these credentials do not guarantee success in any trade. Investment in the share market is subject to market risk, and past performance is not indicative of future results. Recommendations are for informational purposes only and should not be considered as buy or sell advice. Please conduct your own research and consult a financial advisor before making any investment decisions. We will not be liable for any losses incurred from using this information.

#StockInNews#Today’sTradingSetup#TechnicalViews#EquityResearch#SectorBreakouts
mm.PNG
165 likes·34 comments