CHART SPEAKS - SWIGGY
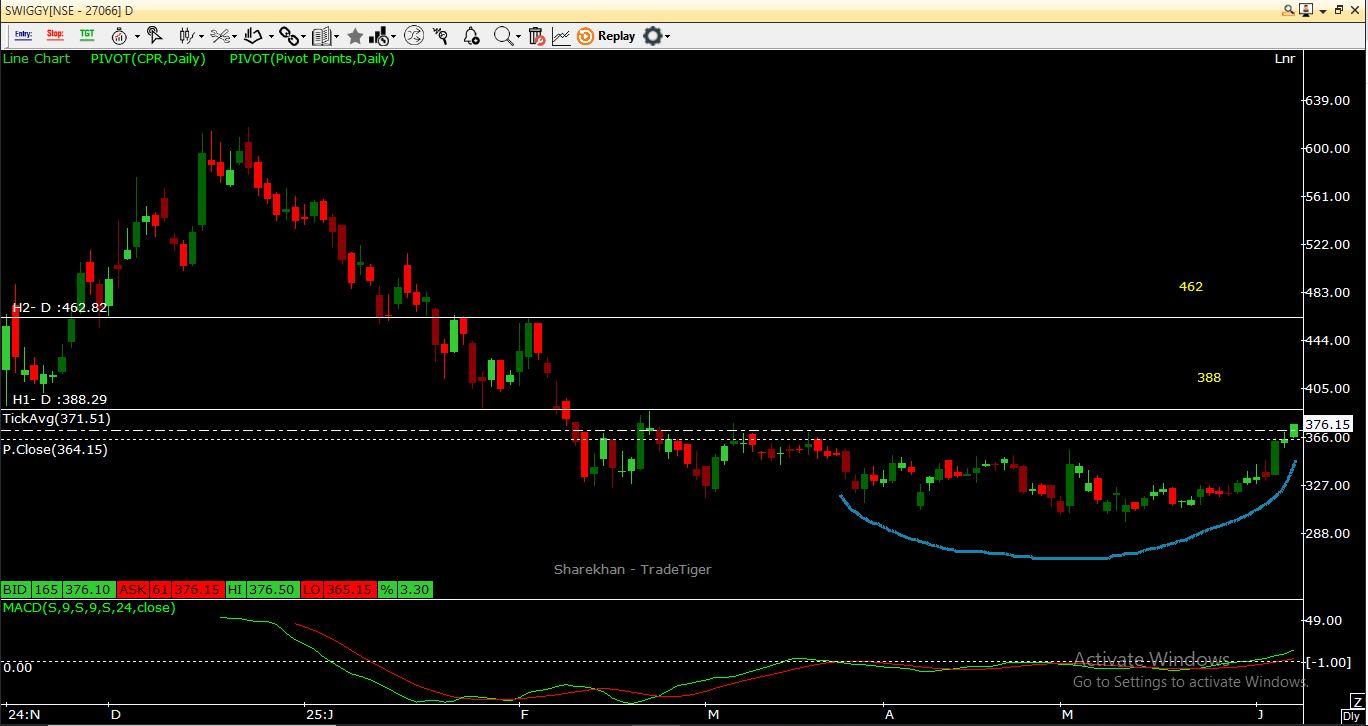
Swiggy's stock analysis reveals a positive sentiment following Morgan Stanley's initiation of coverage with an 'Overweight' rating and a price target of Rs 405, indicating a potential upside of 22%. Current technical indicators suggest a bullish trend, with moving averages signaling buy opportunities. Technical Indicators: Moving Averages: Short-term moving averages are trending upwards, indicating a potential bullish momentum. The 50-day and 200-day moving averages are showing a crossover, which is often a bullish signal. Relative Strength Index (RSI): The RSI is currently around 65, suggesting that the stock is nearing overbought territory but still has room for growth. MACD (Moving Average Convergence Divergence): The MACD line is above the signal line, indicating a bullish trend. Price Targets: First Target: Rs 388, representing a moderate upside from the current price. Second Target: Rs 460, which reflects a more optimistic outlook based on market conditions and operational improvements. Disclaimer- Investment and trading is subject to market risk, take advice from your adviser before taking any trade, above information is only for knowledge purpose, it is not any advice or suggestion.