DLF Ltd. – Chart Speaks
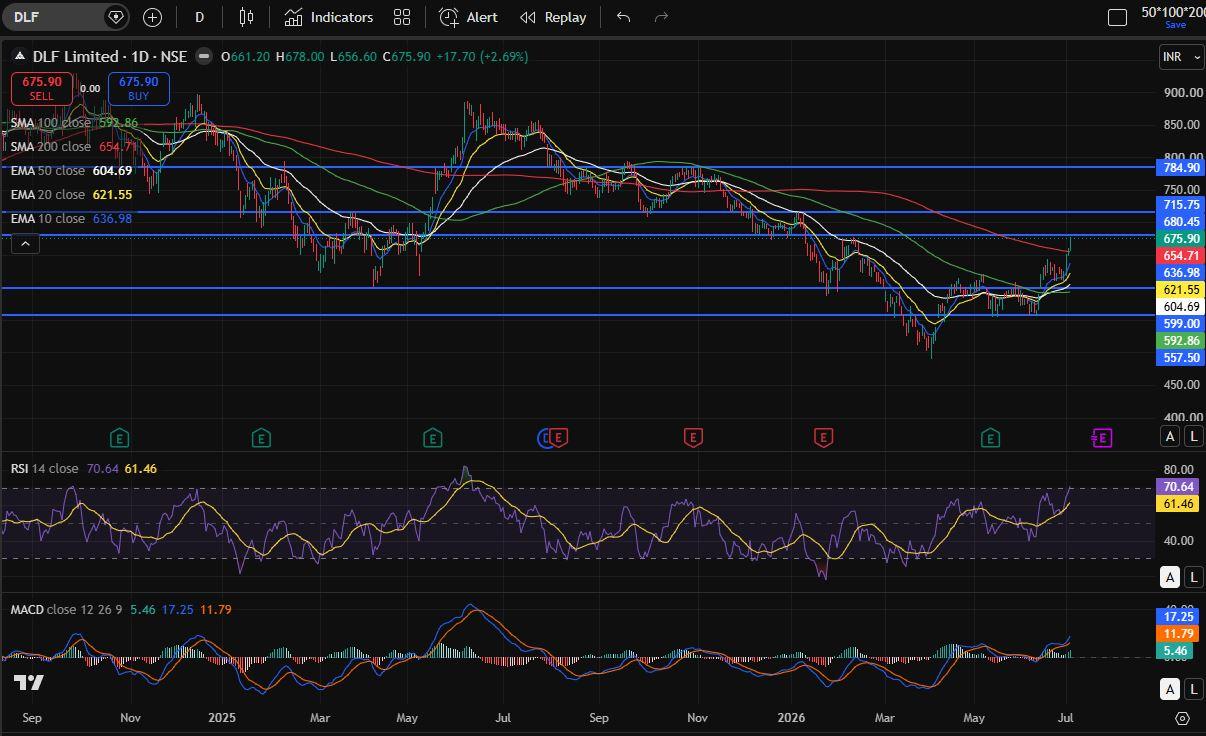
DLF has staged a strong recovery from its recent lows and is now showing signs of a trend reversal. The stock closed at ₹675.90, gaining nearly 2.7%, while sustaining above its short-term moving averages. It is trading above the 10 EMA (₹636.98), 20 EMA (₹621.55), 50 EMA (₹604.69), and 100 SMA (₹592.86), indicating that bullish momentum has strengthened. The recent breakout above the ₹654-655 resistance zone has turned this level into immediate support, improving the overall technical structure.
Momentum indicators continue to support the bullish view. The RSI is at 70.64, reflecting strong buying interest and entering the overbought zone. While this suggests the possibility of short-term profit booking, it also confirms that buyers remain in control. The MACD has given a positive crossover and continues to move higher with expanding bullish histogram bars, reinforcing the ongoing upward momentum.
From a price action perspective, the stock is now approaching an important resistance around ₹680-685. A decisive close above this zone could trigger fresh buying interest and open the path towards ₹715, followed by ₹785 over the medium term. On the downside, ₹655 remains the first line of support, while ₹637 is the next crucial demand zone. As long as DLF holds above these support levels, the broader trend is expected to remain positive.
Overall, the daily chart suggests that DLF has shifted from a consolidation phase into a bullish trend. Traders may continue to maintain a positive bias while the stock trades above ₹655, with any short-term dips towards support likely to attract buying interest. A sustained breakout above ₹685 would further strengthen the bullish outlook and increase the probability of a move towards higher resistance levels.