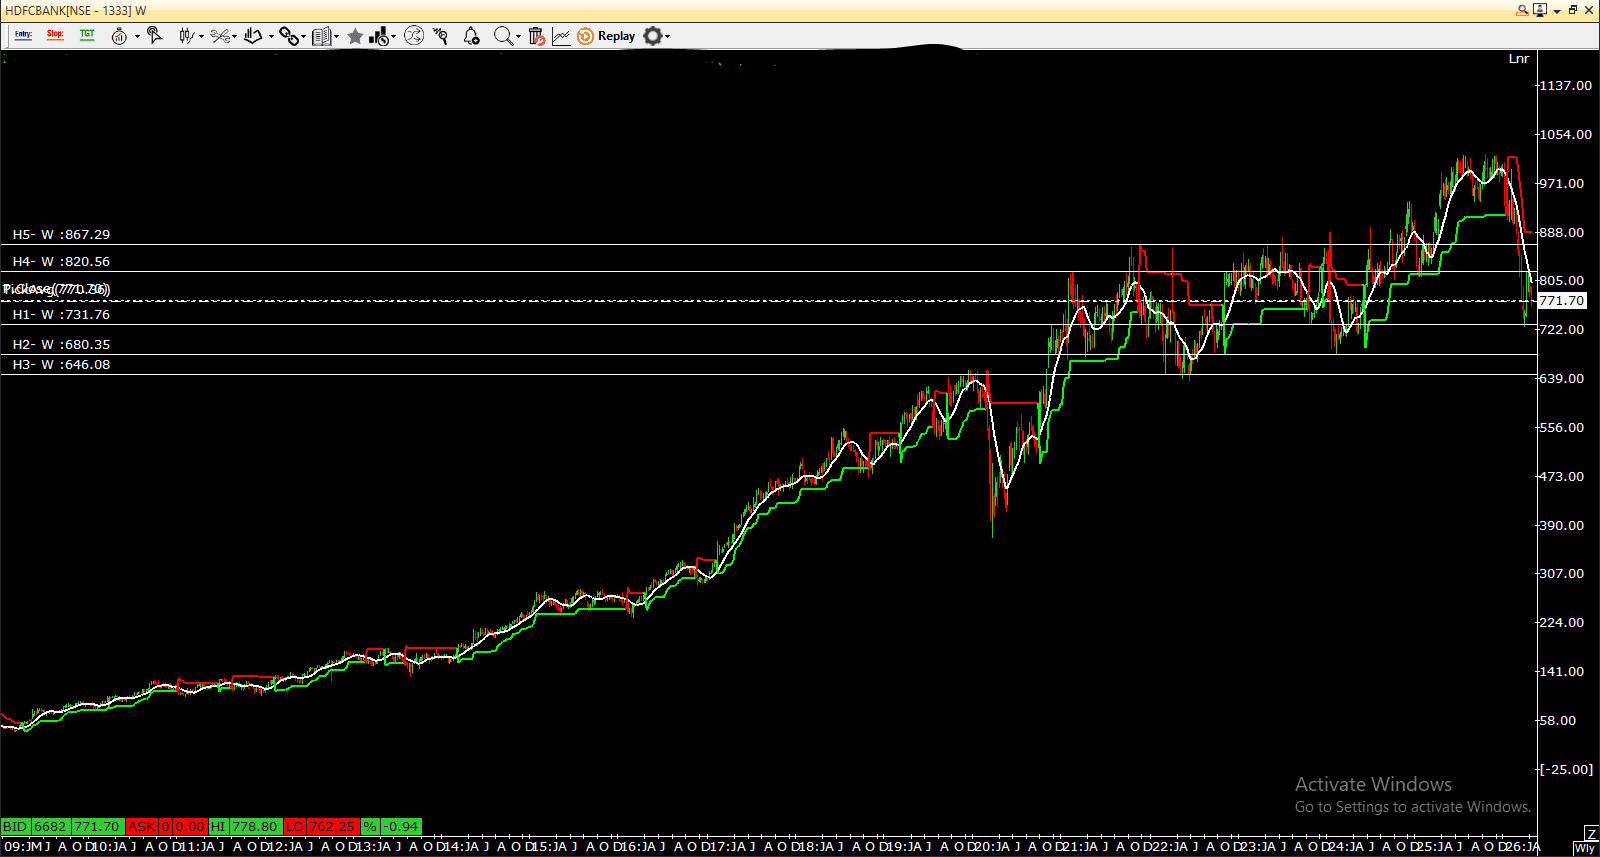
HDFCBANK Weekly Chart
The HDFCBANK weekly chart shows a strong long-term uptrend, where the stock has consistently formed higher highs and higher lows over time. This indicates that, on a broader scale, buyers have remained in control. However, in the most recent weeks, the price action has changed noticeably. After reaching the ₹970–₹1000 zone, the stock has experienced a sharp decline toward the ₹770 area. On a weekly timeframe, such a move reflects sustained selling pressure rather than short-term volatility.
This recent fall suggests that upward momentum is weakening. The earlier smooth trend is no longer intact, and price is now showing signs of instability. The trend-following indicator that was previously supporting the price from below is now being tested or turning, indicating a possible shift from trending to a corrective phase.
Key levels on the chart highlight important zones. Immediate support is around ₹770–₹780, where the price is currently reacting. If this level fails, deeper supports are visible near ₹730 and then ₹680–₹650, which have acted as strong bases in the past. On the upside, resistance is seen around ₹805–₹820, followed by ₹867 and then the previous highs near ₹970+.
Overall, while the long-term structure remains positive, the weekly chart is currently showing a correction or consolidation phase. The stock is moving between support and resistance, indicating a balance between buyers and sellers rather than a clear directional trend.