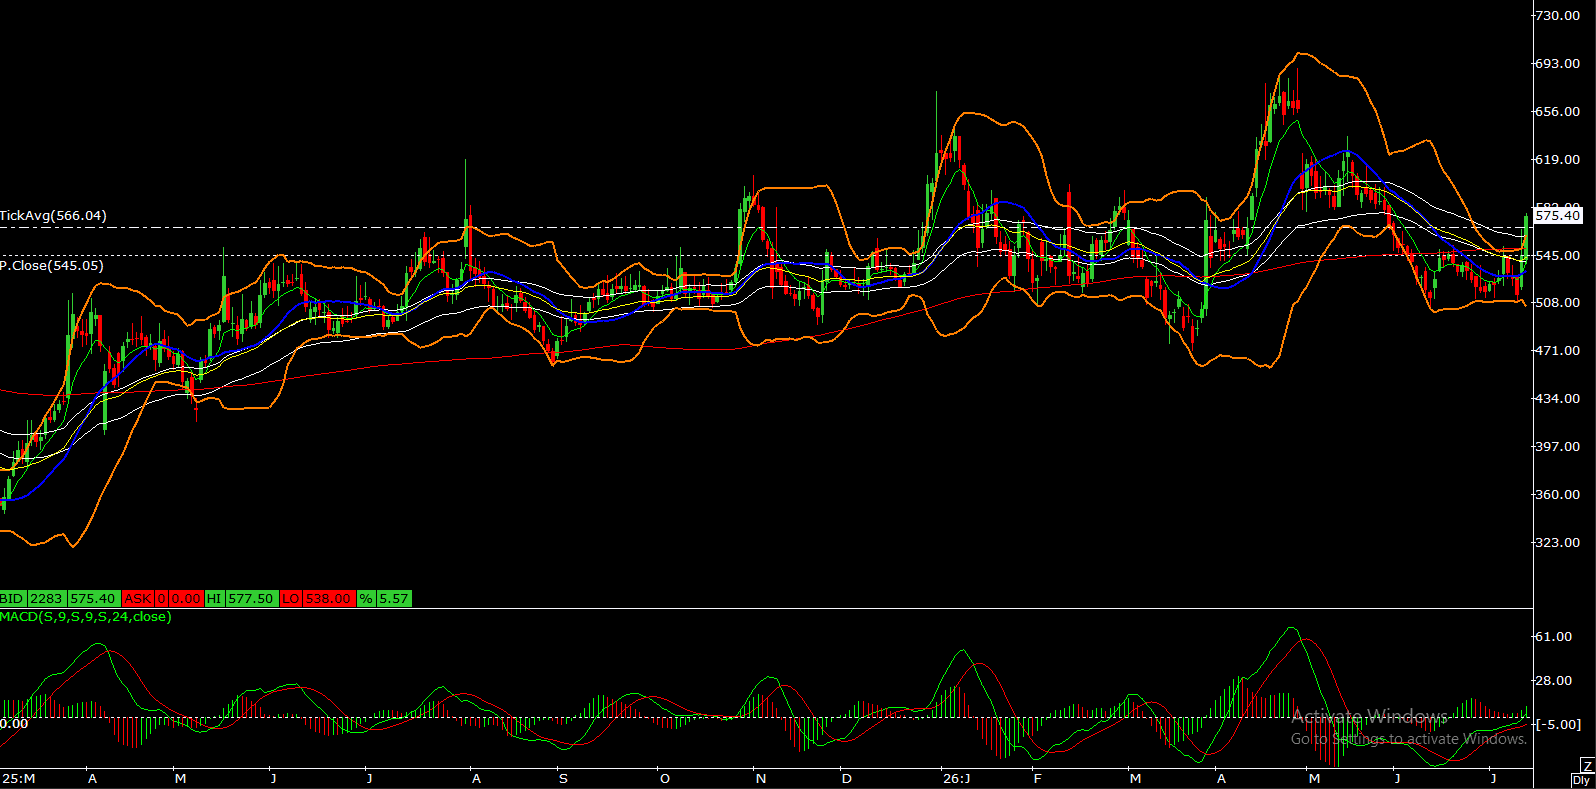
HEG - CHART ANALYSIS
HEG Ltd. is showing signs of a technical recovery ahead of its Q1 FY27 results scheduled on 22 July 2026. Street estimates currently indicate EPS of around ₹10.70 and revenue of about ₹627 crore. The market will closely watch management commentary on graphite electrode demand, pricing trends, exports, and capacity utilization, as these factors are likely to drive the next major move in the stock. Technically, the daily chart has turned constructive after a strong rebound from the ₹530-540 support zone. The stock has reclaimed its short-term moving averages (10, 20 and 50 EMA), while trading comfortably above the 100 and 200-day moving averages, suggesting the broader trend remains positive. Momentum has also improved, with the RSI moving above 60 and the MACD generating a fresh bullish crossover, indicating strengthening buying interest. The immediate hurdle is placed around ₹575-580. A sustained close above this zone could open the door for a move towards ₹600-620, while stronger buying after earnings may extend the rally further. On the downside, ₹550 remains the first important support, followed by ₹535-540. A fall below these levels could weaken the short-term bullish structure. Overall, the chart suggests that investors are turning optimistic ahead of earnings, but the upcoming results and management outlook will be the key trigger for the next directional move. If earnings meet or exceed expectations and demand commentary remains positive, the stock may witness further strength. However, any disappointment in margins or future guidance could lead to short-term profit booking despite the improving technical setup.