Hindalco Industries – Technical Outlook
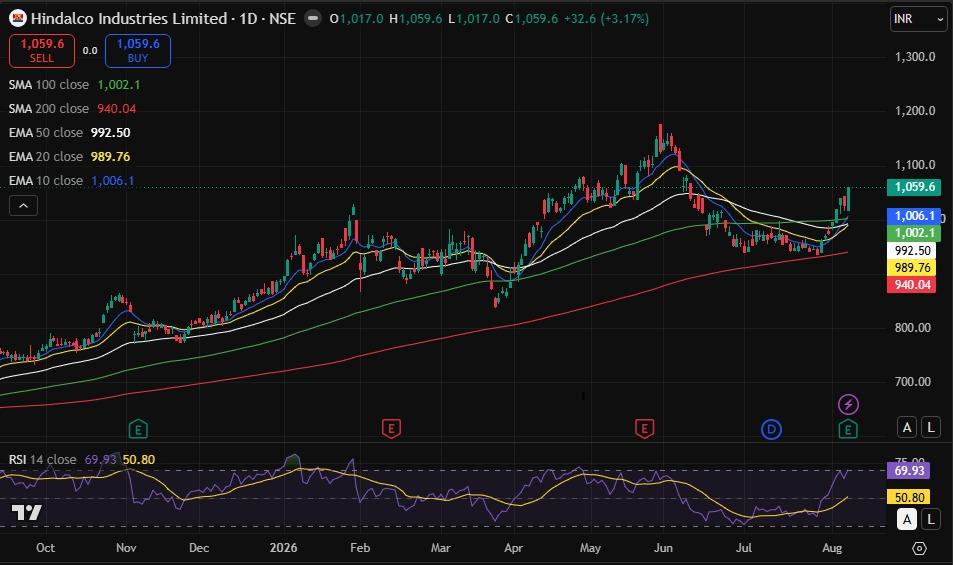
$HINDALCO is showing a strong technical recovery after finding support around the ₹980–990 zone. The stock has formed a higher-low structure and has recently moved decisively above its 10-EMA, 20-EMA, 50-EMA and 100-SMA, indicating a clear improvement in short-term momentum. The stock is currently trading around ₹1,060 and is approaching an important resistance zone near ₹1,075–1,100, which coincides with the previous swing-high area. A sustained breakout above ₹1,100 would strengthen the bullish structure and could trigger further upside towards ₹1,150, followed by ₹1,175. Momentum indicators are also supportive. The RSI is around 70 and has moved sharply higher from the recent oversold zone, confirming strong buying momentum. However, with RSI approaching the overbought territory, some short-term consolidation or profit booking cannot be ruled out near ₹1,075–1,100. On the downside, ₹1,000–1,006 is the immediate support zone, followed by ₹990–992. As long as the stock sustains above ₹1,000, the broader short-term bias remains positive. Key Levels: Upside Resistance: ₹1,075–1,100 / ₹1,150–1,175 Downside Support: ₹1,000–1,006 / ₹990–992 Bias: Positive; breakout above ₹1,100 can accelerate the upside.