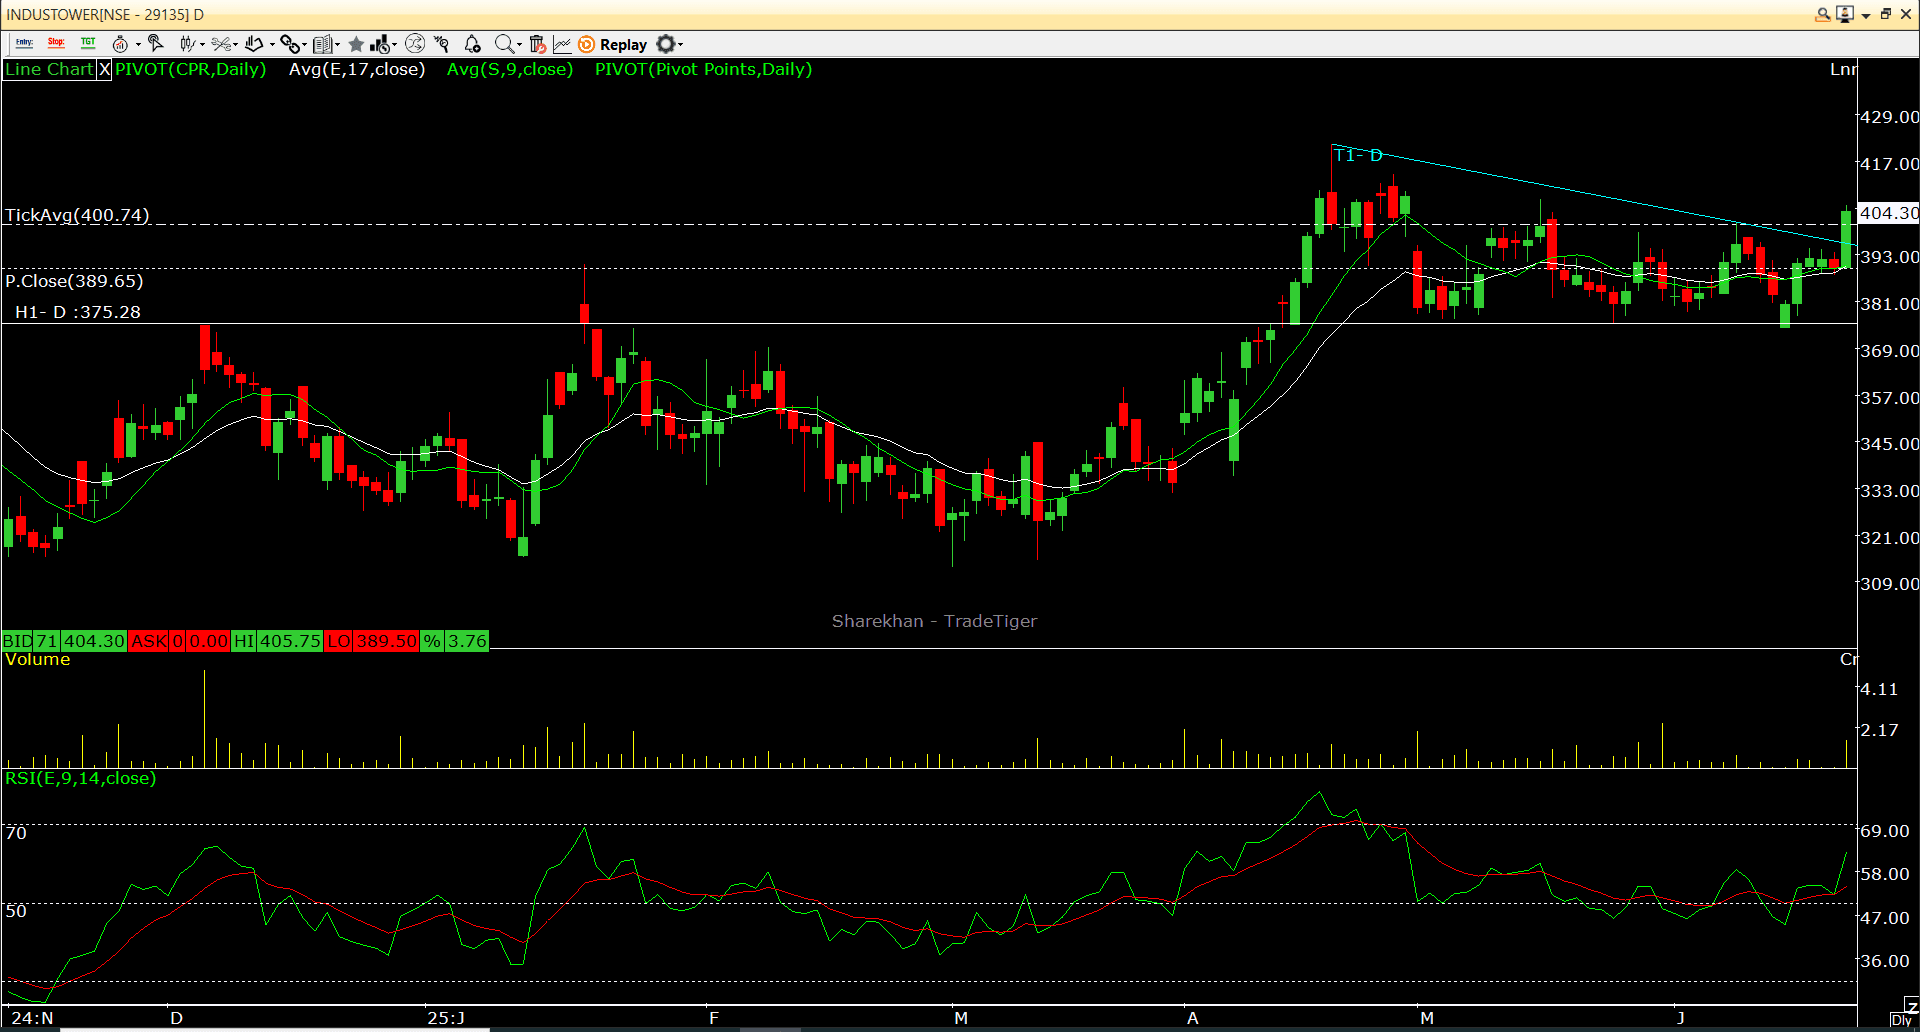
INDUSTOWER - Chart Analysis
Breakout Confirmation: On Friday, the stock experienced a breakout from a falling channel on a daily scale, which was confirmed by significant trading volume. Moving Averages: The stock is currently trading above both its short-term and long-term moving averages. These averages are trending upwards and are arranged in the desired sequence, indicating a strong bullish trend. Momentum Indicators: The momentum indicators suggest strong bullish momentum in the stock, reinforcing the positive outlook. Key Levels to Monitor: Accumulation Zone: Investors may consider observing the price range of Rs 405-400 for potential entry points. Stop-Loss Level: A stop-loss could be set around Rs 385 to manage risk. Target Level: In the short term, the stock may aim to test the level of Rs 440, which could serve as a potential target for price movement. Disclaimer- As a SEBI registered Research Analyst with NISM certification, I want to emphasize that these credentials do not guarantee success in any trade. Investment in the share market is subject to market risk, and past performance is not indicative of future results. Recommendations are for informational purposes only and should not be considered as buy or sell advice. Please conduct your own research and consult a financial advisor before making any investment decisions. We will not be liable for any losses incurred from using this information.