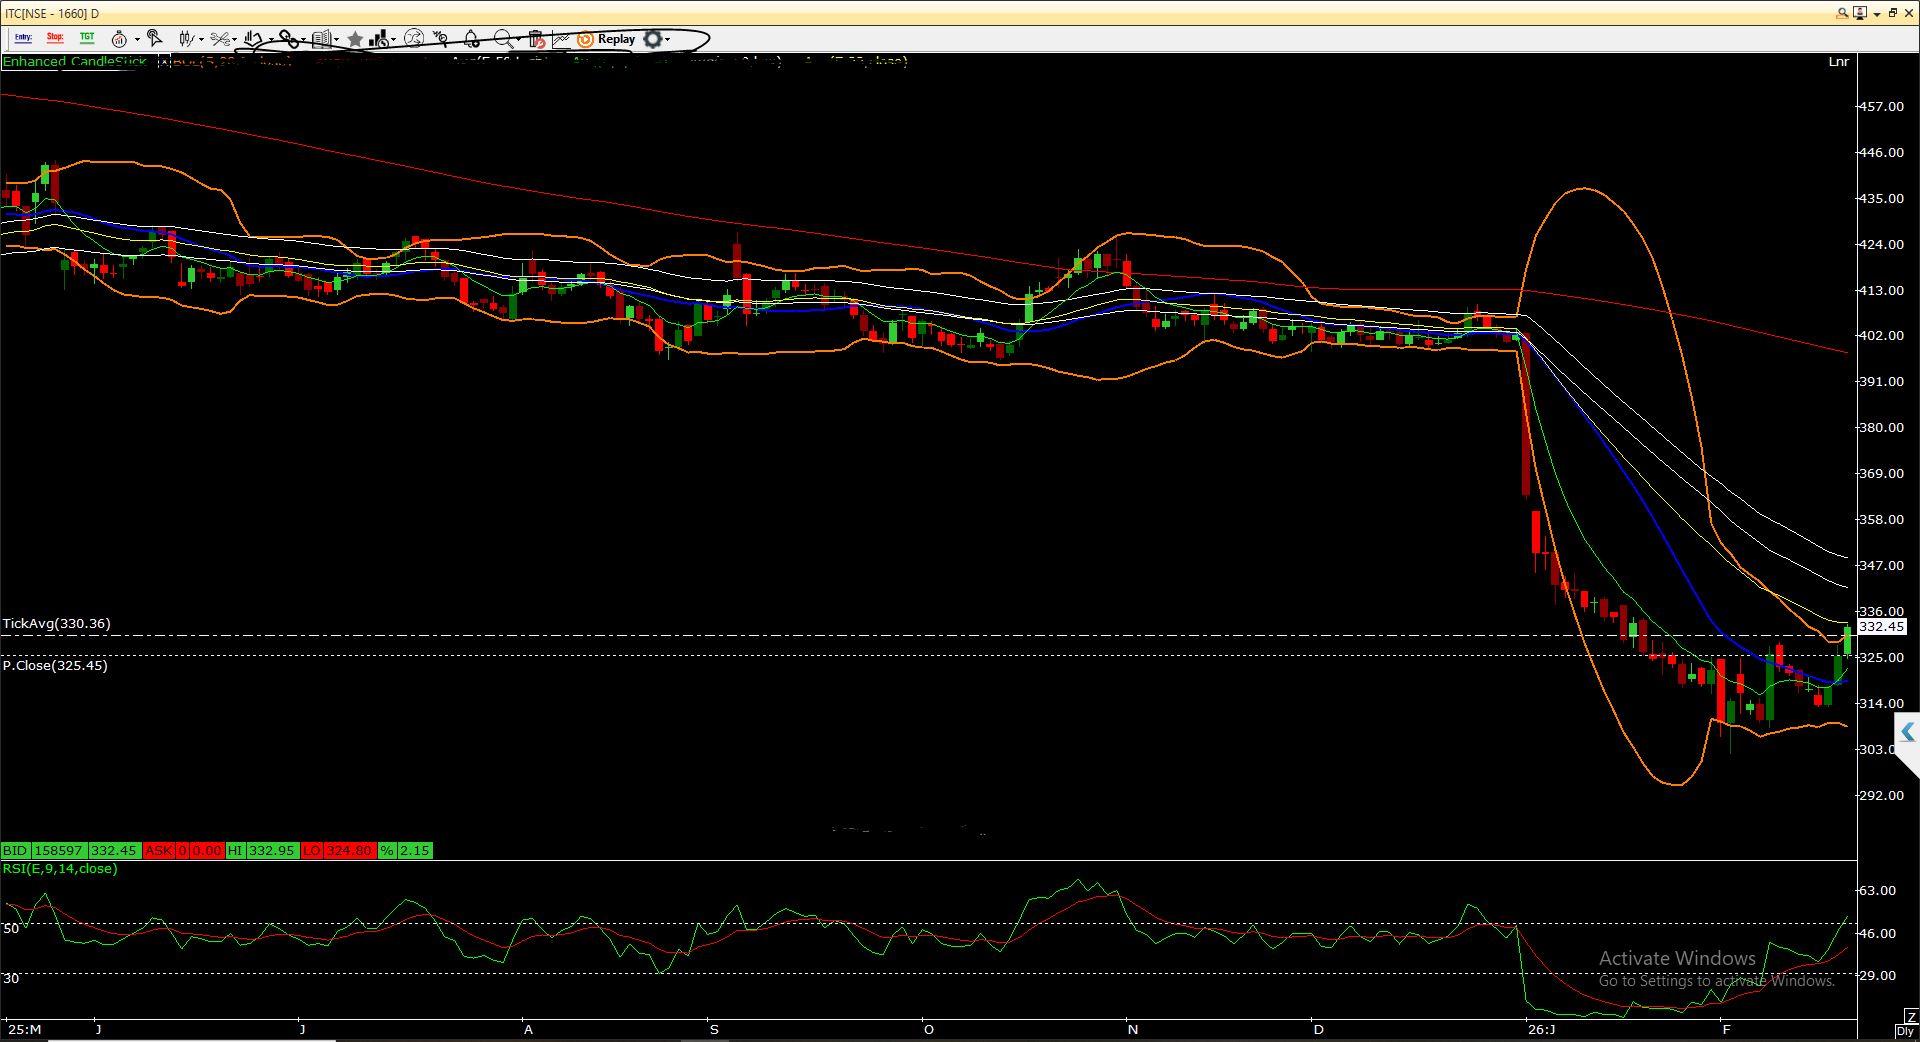
ITC Ltd – Technical Analysis Report
Current Price: ~₹332
Trend Structure: Medium-term downtrend, short-term pullback attempt
Price Action
ITC has witnessed a sharp breakdown from the ₹400–405 zone, followed by heavy selling pressure that dragged the stock toward ₹305–310 levels. The fall was impulsive, indicating strong distribution.
After making a recent swing low near ₹305, the stock has started a mild recovery toward ₹330–335, suggesting short-term short covering.
Moving Averages
Price is still trading below 50, 100 & 200 DMA, confirming the broader bearish trend.
Short-term EMAs (8 & 20) are attempting a bullish crossover, indicating a pullback move.
200 DMA near ₹400 remains a strong long-term resistance.
Bollinger Bands
Price earlier expanded below the lower band during the sharp fall (volatility expansion).
Currently attempting mean reversion toward the middle band (~₹340 area).
Sustained move above ₹345 can trigger further recovery toward ₹360.
RSI (14)
RSI rebounded from oversold zone (~20–25) and is now near 45–50.
Momentum improving but not yet in bullish territory (>60).
Key Levels
Immediate Support: ₹320 / ₹305
Immediate Resistance: ₹340 / ₹360
Major Resistance: ₹400–405
Outlook
As long as price sustains above ₹320, pullback toward ₹345–360 is possible.
Failure below ₹320 may retest ₹305–300 zone.
Medium-term trend remains bearish unless stock closes decisively above ₹360–370.
Bias: Short-term recovery, medium-term cautious