Lloyds Metals & Energy: Trend Turning Stronger
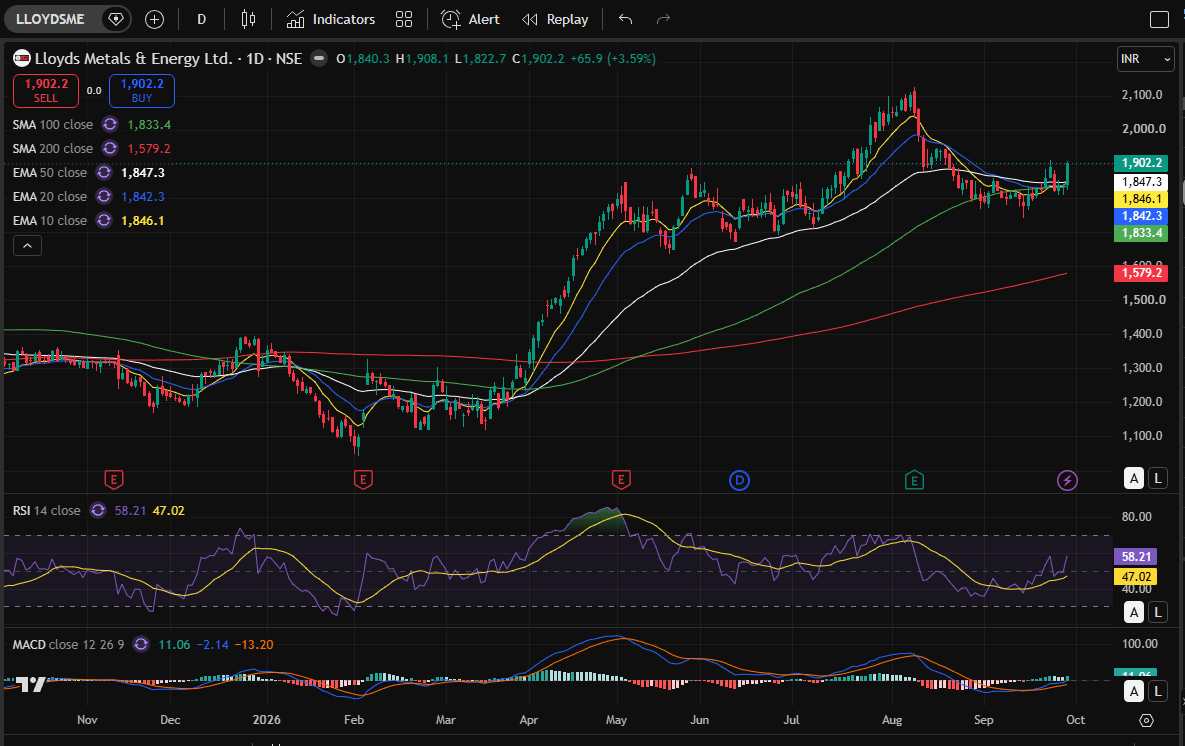
Lloyds Metals & Energy Ltd. is trading around ₹1,902, up 3.59% on the day, with the price moving above its key short- and medium-term moving averages.
The chart shows a positive shift in momentum after the recent consolidation around ₹1,800–1,850. The stock is currently above the 10 EMA (₹1,846), 20 EMA (₹1,842), 50 EMA (₹1,847) and 100 SMA (₹1,833), which indicates that short- and medium-term price structure has improved.
RSI is at 58.21 and has turned upward from lower levels. It is above the 50 zone but still below the overbought area, suggesting that momentum is improving without showing an extreme reading.
MACD is also showing improvement, with the lines turning upward and the histogram recovering from the earlier negative phase. This supports the recent improvement in price momentum, although follow-through buying will be important.
From a technical perspective, ₹1,920–1,950 is the immediate resistance zone. A sustained move above this area could bring ₹2,000 into focus, followed by the previous high zone near ₹2,100. On the downside, ₹1,845–1,830 is an important support area, as multiple moving averages are clustered around this zone.
My view: The technical setup has improved and the stock is showing signs of renewed bullish momentum. However, confirmation above the immediate resistance zone would provide stronger evidence of continuation. Traders should watch price action around ₹1,920–1,950 closely.
Disclosure: I and my family do not have any position in Lloyds Metals & Energy Ltd. at the time of writing. This article is for educational and informational purposes only and is not investment advice.