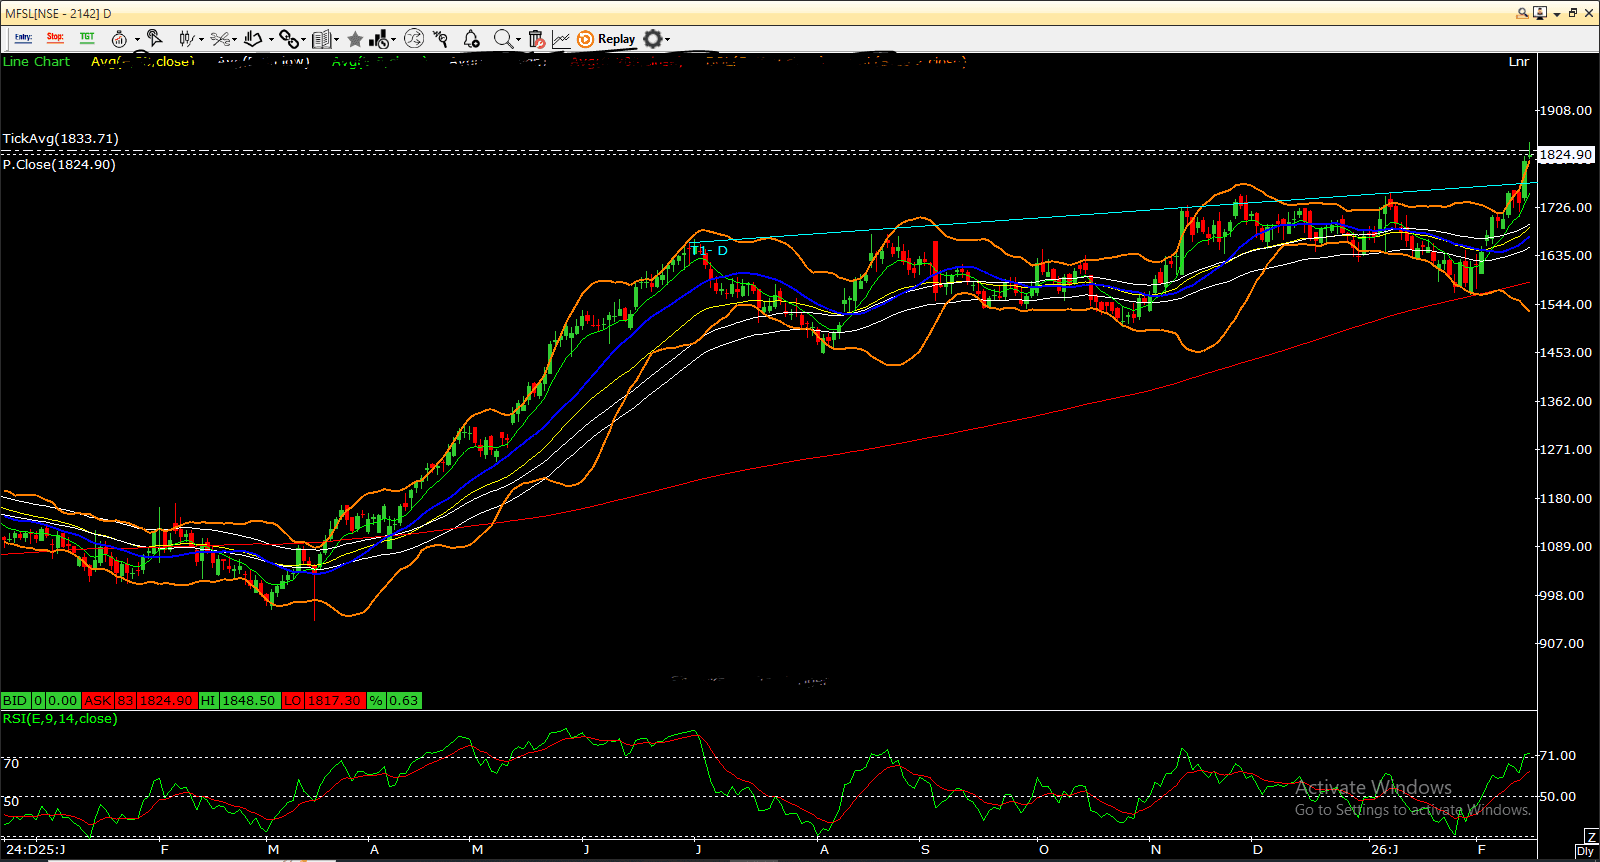
Max Financial Services – Horizontal Breakout With Strong Momentum
Max Financial Services has confirmed a decisive horizontal trendline breakout on the daily chart, marking the end of a prolonged consolidation phase. The breakout is supported by steady follow-through and improving volumes, increasing the reliability of the move and signaling fresh accumulation.
The stock has closed above the upper volatility band for two consecutive sessions. Such sustained trade above the band generally reflects momentum expansion and strong buying interest, typically seen in trending phases rather than exhaustion moves.
Price is comfortably trading above its short and medium-term moving averages, while remaining well supported by the long-term average, reinforcing the broader bullish structure. The alignment of moving averages suggests strengthening trend participation across timeframes.
Momentum indicators further validate the breakout. The MACD histogram bars are expanding on the upside, indicating accelerating bullish momentum. RSI is holding above the 60–70 zone, reflecting sustained strength without visible bearish divergence.
On the relative strength front, the Financial Services/Nifty ratio line is trending higher, indicating sector outperformance versus the broader market. This improves the probability of continued institutional interest, with MFSL well placed to participate in sector leadership.
Trade Setup
Accumulation Zone: 1,830–1,810
Stop Loss: 1,750
Target: 1,960
As long as price sustains above the breakout zone and holds above 1,750, the structure favors continuation toward 1,960 in the near term.
Overall, MFSL is exhibiting classic breakout characteristics supported by momentum expansion, volume participation, and sectoral relative strength.