MOTHERSON - CHART ANALYSIS
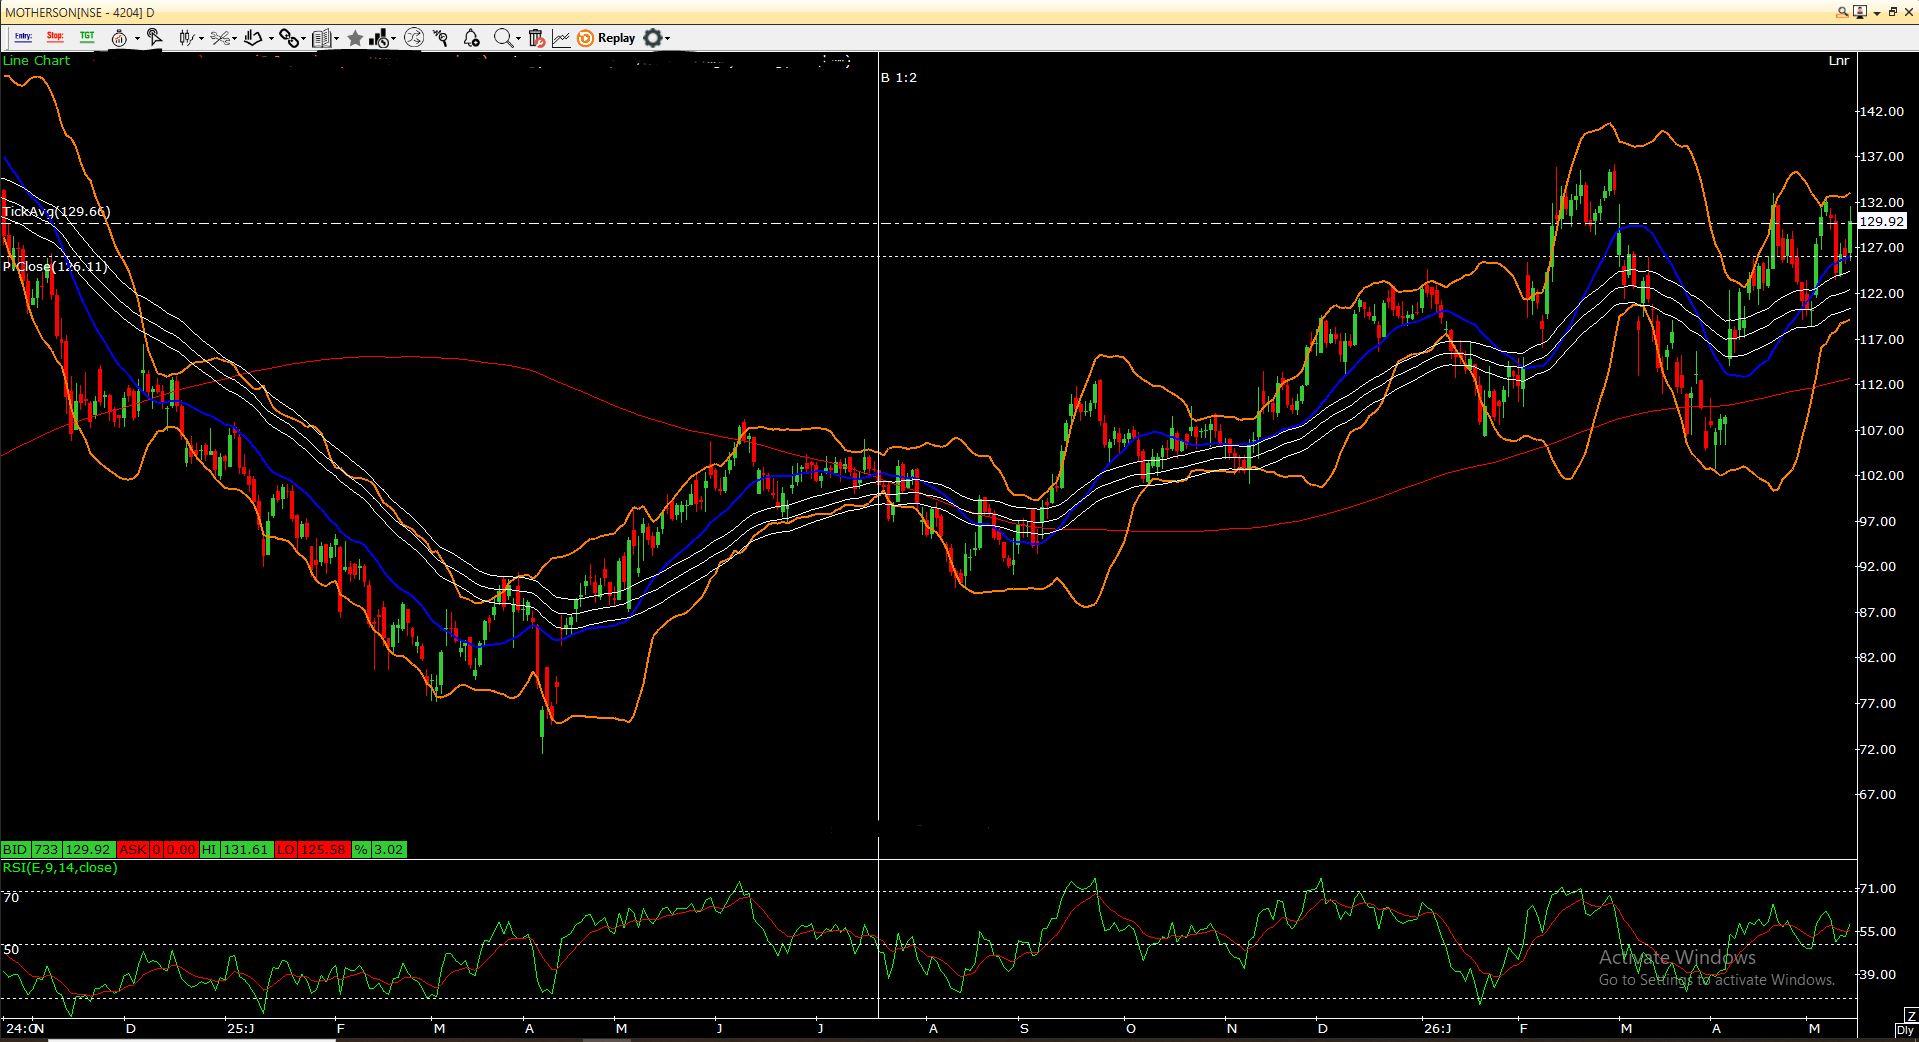
Motherson Sumi Wiring / Motherson is showing a constructive technical setup on the daily chart after a strong rebound from the recent lows near 106–108. The stock has regained momentum and is currently trading around 129–130, above its short-term moving averages, which indicates improving bullish sentiment. Price has also moved back above the 20-DMA and is holding near the upper cluster of the 50-day averages, suggesting buyers are active on dips.
The stock recently faced resistance near 132–133, which is visible from multiple rejections in that zone. A decisive breakout and daily close above 133 can trigger fresh upside momentum toward 137, followed by 142, which is near the upper Bollinger Band and previous swing resistance. Momentum indicators are moderately positive, with RSI near 55, showing strength but not yet in overbought territory—leaving room for further upside.
On the downside, immediate support is placed at 126–127, which aligns with short-term moving averages and recent consolidation levels. A break below this zone may drag the stock toward 122, where stronger support is visible. The major trend support remains near the 200-DMA around 112, keeping the broader structure positive unless that level is broken.
Overall, the chart suggests a buy-on-dips approach as long as the stock holds above 126. Short-term traders can watch for a breakout above 133 for momentum continuation, while positional sentiment remains positive with a bullish bias above 122.