ONGC – Chart Analysis and US Iran Conflict
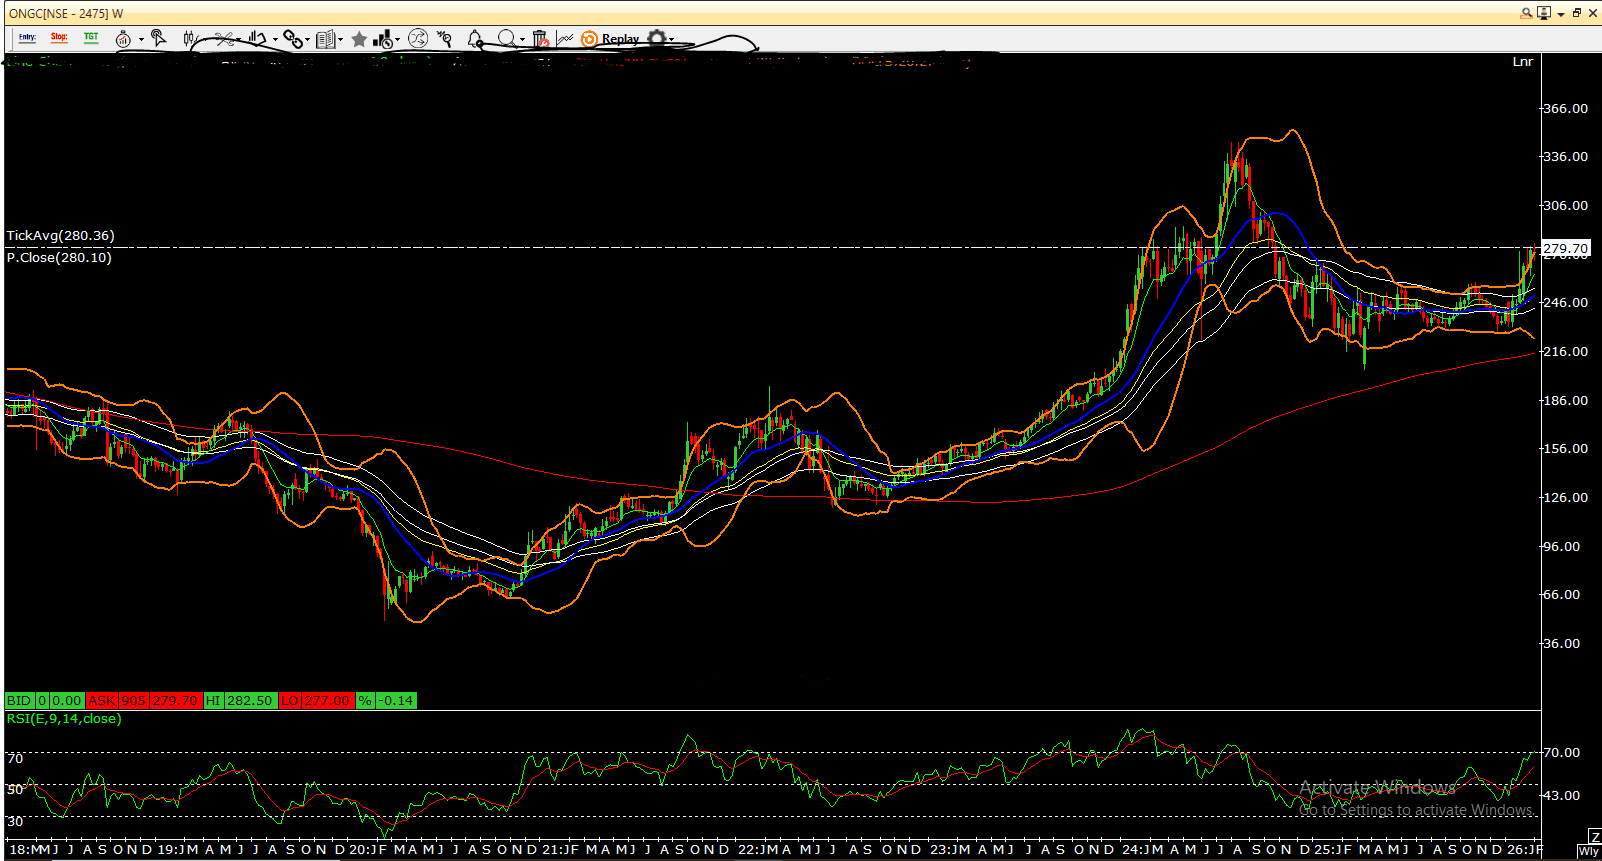
Natural Gas Corporation (ONGC) is displaying a strong weekly breakout structure supported by both technical strength and the prevailing US–Iran geopolitical backdrop. The stock formed a reversal from the 230 zone in the second half of January, which marked a structural base. However, since that higher low is already established and price has moved significantly away from it, the immediate trade setup now revolves around the breakout of the 260 resistance zone rather than the earlier higher-low formation.
The 260 level acted as a strong supply zone for multiple weeks. The stock has now decisively broken above this resistance and is sustaining above it, converting it into support. Price continues to trade above its 50-week and 200-week moving averages, confirming a broader uptrend. The recent close near the upper Bollinger Band suggests momentum expansion and sustained buying interest. RSI on the weekly timeframe is trending upward, supporting continuation bias without showing major bearish divergence.
With the structural shift above 260, the revised trading plan focuses on continuation above 285 as a trigger level. A sustained move above 285 can open upside toward 300 and 315 in the coming weeks. Since 260 has now turned into support, risk management should align with that breakout structure. Therefore, stoploss is revised to 259 on a weekly closing basis. A breakdown below 259 would invalidate the immediate bullish setup and indicate a failed breakout.
On the macro front, escalating US–Iran tensions can create supply concerns in the Middle East, potentially lifting crude oil prices. As an upstream producer, ONGC benefits from higher crude realizations and improved earnings visibility in such an environment. The combination of technical breakout above 260 and geopolitical tailwinds positions ONGC as a constructive bullish candidate with defined risk at 259 and upside potential toward 300–315.