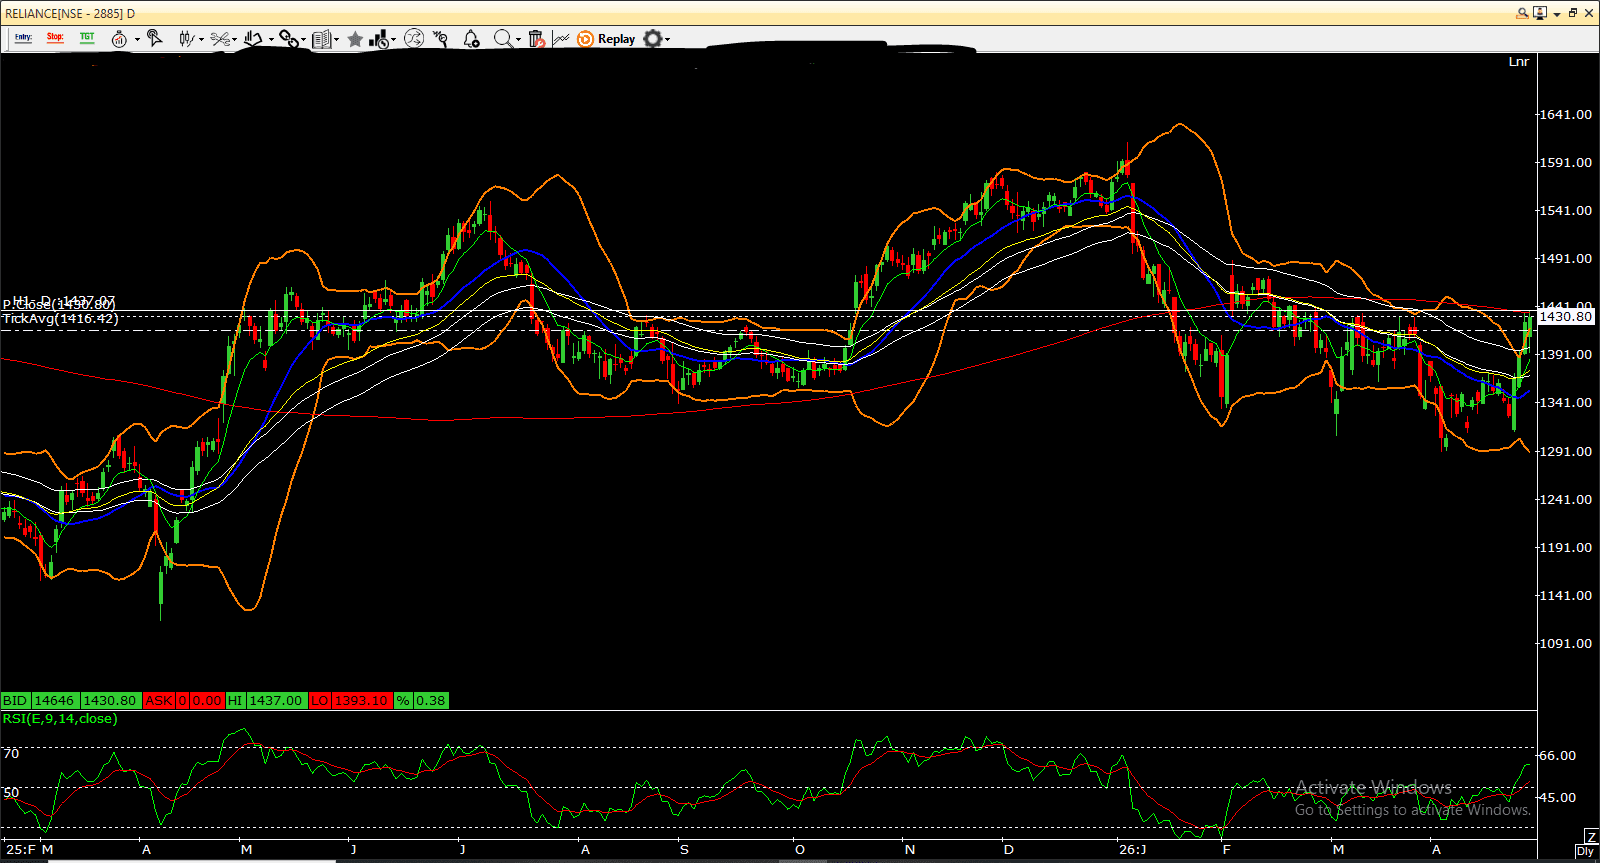
Reliance Daily Chart – Resistance Pressure Near 200 SMA
The Reliance daily chart shows the stock currently trading around ₹1430, approaching a crucial resistance zone near ₹1440. This level is significant because the 200-day moving average is placed here, and the price has reversed multiple times from this area in the recent past. Such repeated rejection indicates that this zone is acting as a strong supply area where sellers are becoming active.
From a short-term perspective, the structure has improved. The price is now trading above the 50 EMA, which suggests a recovery in momentum after the recent downtrend. Additionally, the stock is trading near or slightly above the upper Bollinger Band, indicating strength but also hinting at a possible short-term stretch. When price moves along the upper band, it often reflects bullish momentum, but it can also lead to brief pullbacks or consolidation.
The RSI is currently hovering above 60, which supports the positive momentum. It shows that buying strength has returned, but it is not yet in an extreme overbought zone. This suggests that the trend has strength, but it is also approaching a level where resistance could slow down the move.
Overall, the chart is at a critical point. The ₹1440 zone remains a key barrier, and price action around this level will likely define the next phase. If the stock sustains above this resistance, it may signal continuation of upward momentum. On the other hand, failure to move past this zone could lead to consolidation or a pullback toward lower support levels. At present, the chart reflects improving strength, but still within the influence of a strong resistance overhead.