SBIN- Chart Speaks
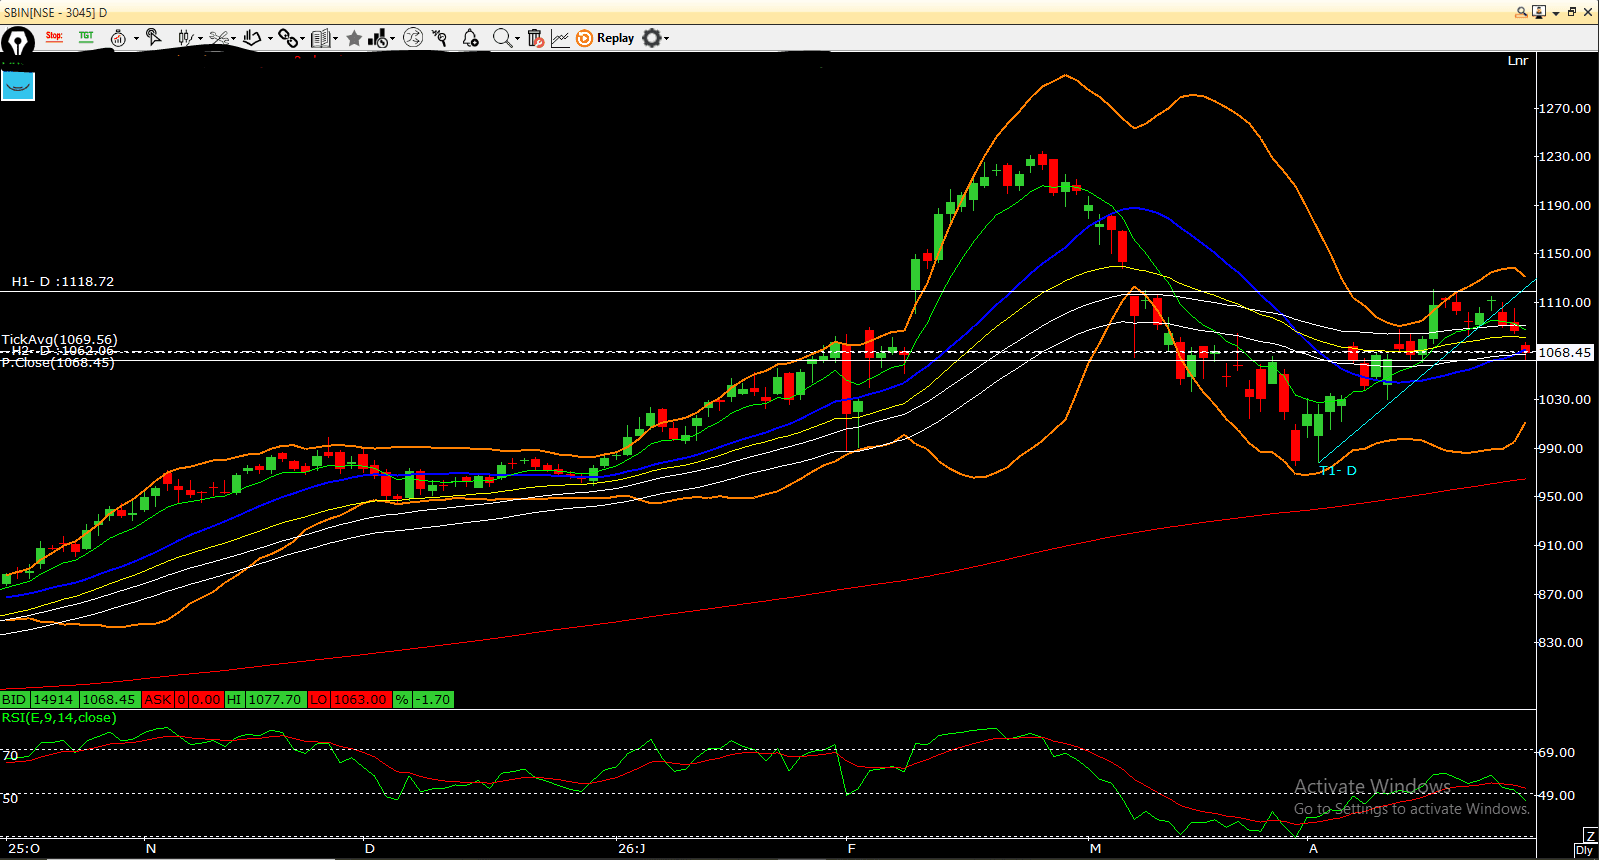
State Bank of India (SBI) is still showing strength from a long-term view as the stock continues to trade above its 200-day average. This usually means the overall trend remains positive. However, in the short term, the stock is facing some pressure and is not moving up easily.
After a strong rally earlier, SBI saw a sharp fall and is now trying to recover. The price is currently struggling near the 20-day and 50-day averages, which are acting as resistance. At the same time, there is a small positive sign as the shorter average is trying to move above the longer one, which may support a gradual recovery.
Looking at key levels on the chart, the immediate support is around 1060–1050, while a stronger support lies near 1020–1000 where the stock had earlier bounced. On the upside, resistance is seen around 1110–1120, and a bigger hurdle is near 1180–1200 where selling pressure was seen before.
The momentum indicator also shows that selling pressure has reduced and the stock is slowly trying to gain strength again.
Overall, SBI appears to be in a recovery phase. The long-term trend is still intact, but in the short term, the stock is moving sideways and trying to build strength. The next move above resistance or below support will decide the clearer direction.